
AUD/USD: the Australian dollar is trading in both directions
05 September 2018, 09:24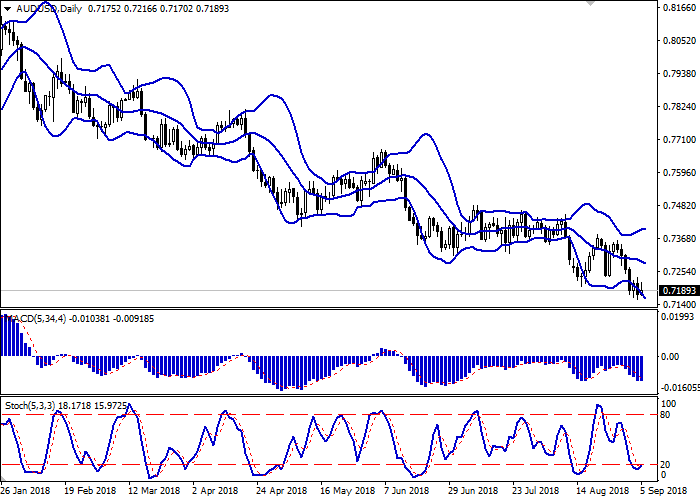
| Scenario | |
|---|---|
| Timeframe | Intraday |
| Recommendation | BUY STOP |
| Entry Point | 0.7240 |
| Take Profit | 0.7300, 0.7322 |
| Stop Loss | 0.7200 |
| Key Levels | 0.7100, 0.7130, 0.7155, 0.7175, 0.7200, 0.7236, 0.7260, 0.7290 |
| Alternative scenario | |
|---|---|
| Recommendation | SELL STOP |
| Entry Point | 0.7165, 0.7145 |
| Take Profit | 0.7100 |
| Stop Loss | 0.7200 |
| Key Levels | 0.7100, 0.7130, 0.7155, 0.7175, 0.7200, 0.7236, 0.7260, 0.7290 |
Current trend
AUD fell against USD on Tuesday, updating the record low of May 2016.
Yesterday, RBA decided to keep the interest rate on the level of 1.5%. The accompanying statement says that the regulator expects the growth of the national economy by slightly more than 3% both in 2018 and 2019. However, there's uncertainty because of the slow growth of wages and other household income, and high level of debt. The situation on the labor market is improving: in the next few years, the unemployment rate may drop to 5.0%. Generally, low interest rates continue to support the Australian economy.
Today, moderate support for AUD is provided by data on Australia's GDP for Q2 2018. YoY, the growth of economy accelerated from 3.1% to 3.4%, with expected 2.8%. QoQ, the growth slowed down from 1.0% to 0.9%, which was still better than the forecast of 0.7%.
Support and resistance
Bollinger Bands in D1 chart demonstrate a gradual decrease. The price range is widening from below but does not conform to the development of the downtrend yet. MACD is declining keeping a stable sell signal (located below the signal line). Stochastic, having approached its minimum levels, is prone to corrective upward reversal.
It is worth looking into the risk of corrective growth formation in the short and/or ultra-short term.
Resistance levels: 0.7200, 0.7236, 0.7260, 0.7290.
Support levels: 0.7175, 0.7155, 0.7130, 0.7100.
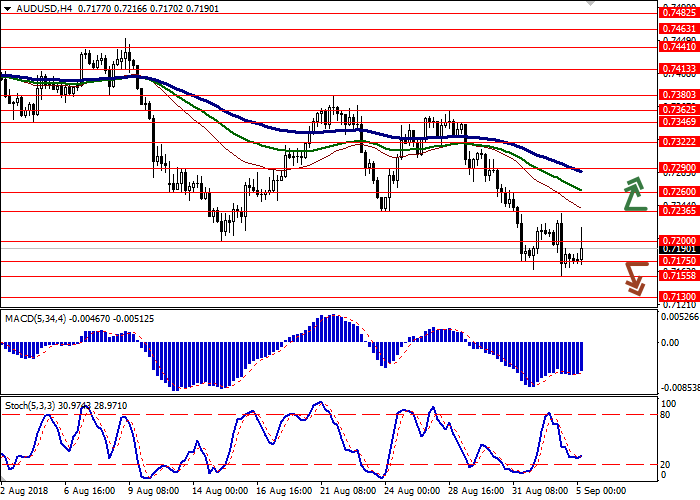

Trading tips
To open long positions one can rely on the breakout of 0.7236 if final buy signals are formed by the indicators. Take profit — 0.7300 or 0.7322. Stop loss — 0.7200. Implementation period: 2-3 days.
The breakdown of 0.7175 or 0.7150 may serve as a signal to further sales with target at 0.7100. Stop loss — 0.7200. Implementation period: 1-2 days.
AUD fell against USD on Tuesday, updating the record low of May 2016.
Yesterday, RBA decided to keep the interest rate on the level of 1.5%. The accompanying statement says that the regulator expects the growth of the national economy by slightly more than 3% both in 2018 and 2019. However, there's uncertainty because of the slow growth of wages and other household income, and high level of debt. The situation on the labor market is improving: in the next few years, the unemployment rate may drop to 5.0%. Generally, low interest rates continue to support the Australian economy.
Today, moderate support for AUD is provided by data on Australia's GDP for Q2 2018. YoY, the growth of economy accelerated from 3.1% to 3.4%, with expected 2.8%. QoQ, the growth slowed down from 1.0% to 0.9%, which was still better than the forecast of 0.7%.
Support and resistance
Bollinger Bands in D1 chart demonstrate a gradual decrease. The price range is widening from below but does not conform to the development of the downtrend yet. MACD is declining keeping a stable sell signal (located below the signal line). Stochastic, having approached its minimum levels, is prone to corrective upward reversal.
It is worth looking into the risk of corrective growth formation in the short and/or ultra-short term.
Resistance levels: 0.7200, 0.7236, 0.7260, 0.7290.
Support levels: 0.7175, 0.7155, 0.7130, 0.7100.
Trading tips
To open long positions one can rely on the breakout of 0.7236 if final buy signals are formed by the indicators. Take profit — 0.7300 or 0.7322. Stop loss — 0.7200. Implementation period: 2-3 days.
The breakdown of 0.7175 or 0.7150 may serve as a signal to further sales with target at 0.7100. Stop loss — 0.7200. Implementation period: 1-2 days.


No comments:
Write comments