
XAU/USD: technical analysis
22 August 2018, 11:33
| Scenario | |
|---|---|
| Timeframe | Weekly |
| Recommendation | SELL STOP |
| Entry Point | 1189.0 |
| Take Profit | 1174.0, 1160.0 |
| Stop Loss | 1198.0 |
| Key Levels | 1160.0, 1174.0, 1189.0, 1217.0, 1235.0, 1259.0 |
| Alternative scenario | |
|---|---|
| Recommendation | BUY STOP |
| Entry Point | 1217.0 |
| Take Profit | 1235.0, 1259.0 |
| Stop Loss | 1204.0 |
| Key Levels | 1160.0, 1174.0, 1189.0, 1217.0, 1235.0, 1259.0 |
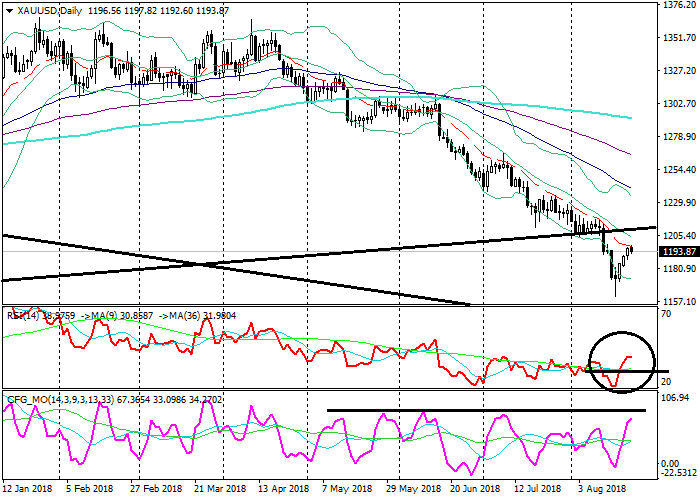
XAU/USD, D1
On the daily chart, the instrument is correcting up from the lower line of the Bollinger Bands. The price remains below its moving averages that are directed down. The RSI is growing, having left the oversold zone. The Composite is approaching its recent resistance region.
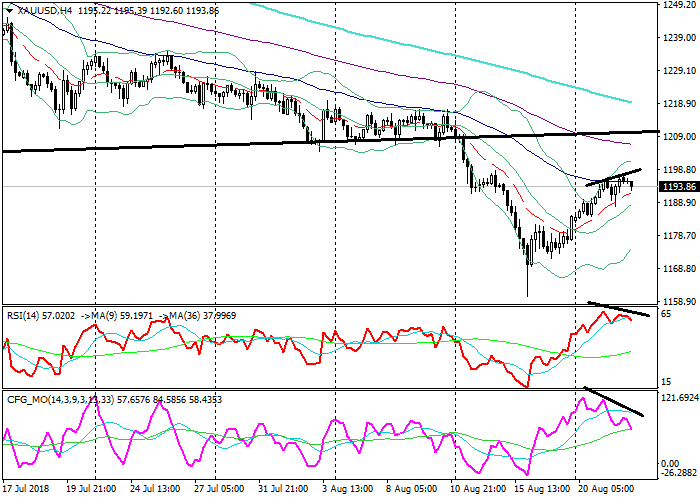
XAU/USD, H4
On the 4-hour chart, the instrument is trading in the upper Bollinger band. The price remains below the EMA65, EMA130 and SMA200 that are directed down. The RSI is turning down, having formed a Bearish divergence with the price. The Composite is showing similar dynamics.
Key levels
Support levels: 1189.0 (local lows), 1174.0 (local lows), 1160.0 (local lows).
Resistance levels: 1217.0 (local highs), 1235.0 (December 2017 lows), 1259.0 (February 2017 highs).
Trading tips
The price has broken down its long-term ascending trendline. The fall could continue.
Short positions can be opened from the level of 1189.0 with targets at 1174.0, 1160.0 and stop-loss at 1198.0. Validity – 3-5 days.
Long positions can be opened from the level of 1217.0 with targets at 1235.0, 1259.0 and stop-loss at 1204.0. Validity – 3-5 days.
On the daily chart, the instrument is correcting up from the lower line of the Bollinger Bands. The price remains below its moving averages that are directed down. The RSI is growing, having left the oversold zone. The Composite is approaching its recent resistance region.
XAU/USD, H4
On the 4-hour chart, the instrument is trading in the upper Bollinger band. The price remains below the EMA65, EMA130 and SMA200 that are directed down. The RSI is turning down, having formed a Bearish divergence with the price. The Composite is showing similar dynamics.
Key levels
Support levels: 1189.0 (local lows), 1174.0 (local lows), 1160.0 (local lows).
Resistance levels: 1217.0 (local highs), 1235.0 (December 2017 lows), 1259.0 (February 2017 highs).
Trading tips
The price has broken down its long-term ascending trendline. The fall could continue.
Short positions can be opened from the level of 1189.0 with targets at 1174.0, 1160.0 and stop-loss at 1198.0. Validity – 3-5 days.
Long positions can be opened from the level of 1217.0 with targets at 1235.0, 1259.0 and stop-loss at 1204.0. Validity – 3-5 days.


No comments:
Write comments