
Bitcoin: technical analysis
22 August 2018, 11:30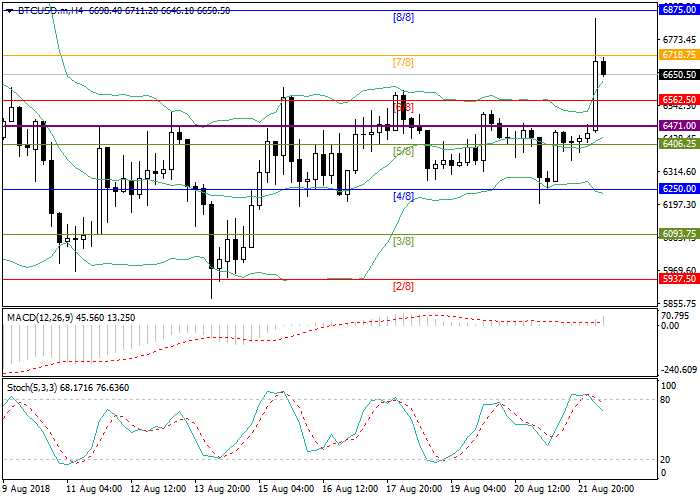
| Scenario | |
|---|---|
| Timeframe | Intraday |
| Recommendation | BUY STOP |
| Entry Point | 6900.00 |
| Take Profit | 7031.25, 7187.50 |
| Stop Loss | 6805.00 |
| Key Levels | 6250.00, 6406.25, 6430.00, 6562.50, 6718.75, 6875.00, 7031.25, 7187.50 |
| Alternative scenario | |
|---|---|
| Recommendation | SELL STOP |
| Entry Point | 6610.00 |
| Take Profit | 6430.00 |
| Stop Loss | 6670.00 |
| Key Levels | 6250.00, 6406.25, 6430.00, 6562.50, 6718.75, 6875.00, 7031.25, 7187.50 |
Current trend
After the jump to the level of 6699.30, Bitcoin price was quickly corrected to the area of 6661.40, where it is now consolidating. The probability of a downward correction to the region of 6430.00, corresponding to the midline of Bollinger bands, maintains. The possibility of a downward correction will increase if sellers decrease the rate below 6620.00, corresponding to the upper border of Bollinger bands. From the level of 6430.00, a rebound is possible, while its breakdown will lead to a decrease to the level of 6250.00, corresponding to the lower border of Bollinger bands.
The restoration of the upward trend is possible after the breakout and consolidation above the level of 6875.00 (Murrey [8/8]), within the strong resistance zone. Consolidation above this zone will let Bitcoin grow to the area of 7031.25 (Murrey [+1/8])–(Murrey [+2/8]).
On the 4-hour chart, technical indicators keep buy signal but do not exclude the development of a downward correction in the short term. MACD grows in the positive zone, reflecting the influence of buyers. Bollinger bands diverge, pointing to the development of an upward trend. However, the breakdown of the upper border of Bollinger Bands and Stochastic, pointing downwards, reflect that the downward correction is still possible.
Support and resistance
Resistance levels: 6718.75, 6875.00, 7031.25, 7187.50.
Support levels: 6562.50, 6430.00, 6406.25, 6250.00.

Trading tips
Long positions can be opened above the level of 6875.00 with the targets in the area of 7031.25–7187.50 and stop loss at 6805.00.
Short positions can be opened below the level of 6620.00 with a target around 6430.00 and stop loss 6670.00.
After the jump to the level of 6699.30, Bitcoin price was quickly corrected to the area of 6661.40, where it is now consolidating. The probability of a downward correction to the region of 6430.00, corresponding to the midline of Bollinger bands, maintains. The possibility of a downward correction will increase if sellers decrease the rate below 6620.00, corresponding to the upper border of Bollinger bands. From the level of 6430.00, a rebound is possible, while its breakdown will lead to a decrease to the level of 6250.00, corresponding to the lower border of Bollinger bands.
The restoration of the upward trend is possible after the breakout and consolidation above the level of 6875.00 (Murrey [8/8]), within the strong resistance zone. Consolidation above this zone will let Bitcoin grow to the area of 7031.25 (Murrey [+1/8])–(Murrey [+2/8]).
On the 4-hour chart, technical indicators keep buy signal but do not exclude the development of a downward correction in the short term. MACD grows in the positive zone, reflecting the influence of buyers. Bollinger bands diverge, pointing to the development of an upward trend. However, the breakdown of the upper border of Bollinger Bands and Stochastic, pointing downwards, reflect that the downward correction is still possible.
Support and resistance
Resistance levels: 6718.75, 6875.00, 7031.25, 7187.50.
Support levels: 6562.50, 6430.00, 6406.25, 6250.00.
Trading tips
Long positions can be opened above the level of 6875.00 with the targets in the area of 7031.25–7187.50 and stop loss at 6805.00.
Short positions can be opened below the level of 6620.00 with a target around 6430.00 and stop loss 6670.00.


No comments:
Write comments