
XAG/USD: prices are falling
13 August 2018, 10:00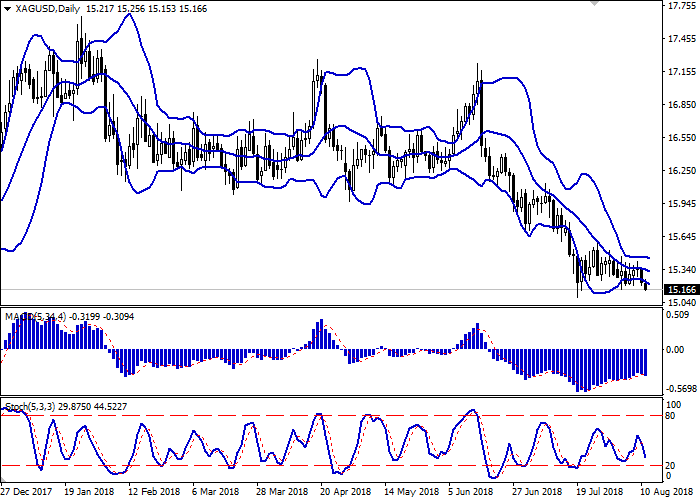
| Scenario | |
|---|---|
| Timeframe | Intraday |
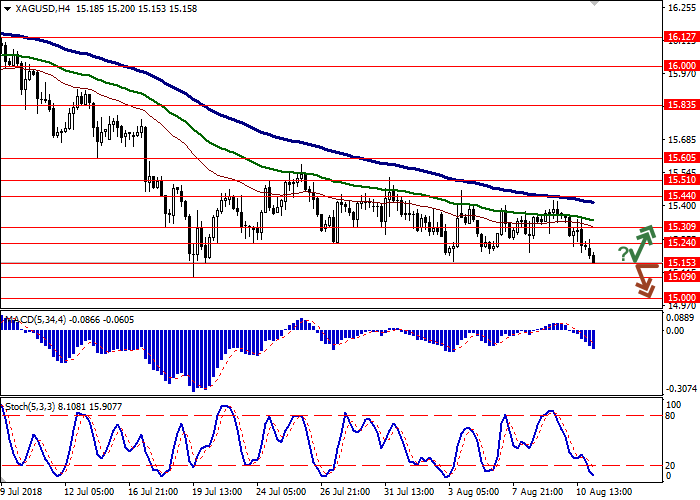
| Recommendation | BUY STOP |
| Entry Point | 15.30 |
| Take Profit | 15.44, 15.51 |
| Stop Loss | 15.10 |
| Key Levels | 15.00, 15.09, 15.15, 15.24, 15.30, 15.44, 15.51 |
| Alternative scenario | |
|---|---|
| Recommendation | SELL STOP |
| Entry Point | 15.13 |
| Take Profit | 15.00 |
| Stop Loss | 15.24 |
| Key Levels | 15.00, 15.09, 15.15, 15.24, 15.30, 15.44, 15.51 |
Current trend
On Friday, silver prices declined, balancing the growth in the middle of the week, due to concerns about the economic crisis in Turkey. In addition, USD was supported by the positive July consumer inflation statistics.
Silver is also under pressure of expectation of further Fed’s interest rate growth. According to forecasts, the regulator can increase it in September, despite some wave of criticism from US President Donald Trump.
Support and resistance
On the daily chart, Bollinger bands are moderately reduced. The price range is widening from below, but not as fast as the "bearish" dynamic develops. MACD reversed downwards, forming a sell signal (the histogram is below the signal line). Stochastic falls more actively but is already approaching its lows, which indicate that silver is oversold in the short or ultra-short term.
Current indicators’ readings do not contradict the further development of the "bearish" trend in the short term.
Resistance levels: 15.24, 15.30, 15.44, 15.51.
Support levels: 15.15, 15.09, 15.00.

Trading tips
Long positions can be opened after a rebound from level 15.15 and breakout of level 15.24 with the target at 15.44 or 15.51. Stop loss is 15.10. Implementation period: 2–3 days.
Short positions can be opened after the breakdown of the level of 15.15 with the target near the level of 15.00. Stop loss is 15.24. Implementation period: 1–2 days.
On Friday, silver prices declined, balancing the growth in the middle of the week, due to concerns about the economic crisis in Turkey. In addition, USD was supported by the positive July consumer inflation statistics.
Silver is also under pressure of expectation of further Fed’s interest rate growth. According to forecasts, the regulator can increase it in September, despite some wave of criticism from US President Donald Trump.
Support and resistance
On the daily chart, Bollinger bands are moderately reduced. The price range is widening from below, but not as fast as the "bearish" dynamic develops. MACD reversed downwards, forming a sell signal (the histogram is below the signal line). Stochastic falls more actively but is already approaching its lows, which indicate that silver is oversold in the short or ultra-short term.
Current indicators’ readings do not contradict the further development of the "bearish" trend in the short term.
Resistance levels: 15.24, 15.30, 15.44, 15.51.
Support levels: 15.15, 15.09, 15.00.
Trading tips
Long positions can be opened after a rebound from level 15.15 and breakout of level 15.24 with the target at 15.44 or 15.51. Stop loss is 15.10. Implementation period: 2–3 days.
Short positions can be opened after the breakdown of the level of 15.15 with the target near the level of 15.00. Stop loss is 15.24. Implementation period: 1–2 days.


No comments:
Write comments