
WTI Crude Oil: oil prices drop
15 August 2018, 11:26
| Scenario | |
|---|---|
| Timeframe | Intraday |
| Recommendation | BUY STOP |
| Entry Point | 66.55 |
| Take Profit | 67.50, 68.00 |
| Stop Loss | 65.64, 65.50 |
| Key Levels | 64.05, 64.50, 65.00, 65.64, 66.48, 67.00, 67.50, 68.00 |
| Alternative scenario | |
|---|---|
| Recommendation | SELL STOP |
| Entry Point | 65.55 |
| Take Profit | 64.50, 64.05 |
| Stop Loss | 66.48 |
| Key Levels | 64.05, 64.50, 65.00, 65.64, 66.48, 67.00, 67.50, 68.00 |
Current trend
Yesterday, oil prices declined, despite the fact that during the day they traded in an upward direction due to OPEC reports that Saudi Arabia reduced production by 52.8 thousand barrels per day, bringing it to 10.387 million barrels per day in July. Saudi Arabia reported an even greater reduction by 200.5 thousand barrels per day.
At the end of the afternoon session, investors began to close profitable positions, and API Weekly Crude Oil Stock release pulled it downwards. It increased by 3.66 million barrels after a decrease of 6 million barrels over the previous period.
On Wednesday, investors wait for EIA Weekly Crude Oil Stock release. Earlier, the forecast assumed a decrease by 2.667 million barrels, but given the API statistics, the actual dynamics may differ significantly.
Support and resistance
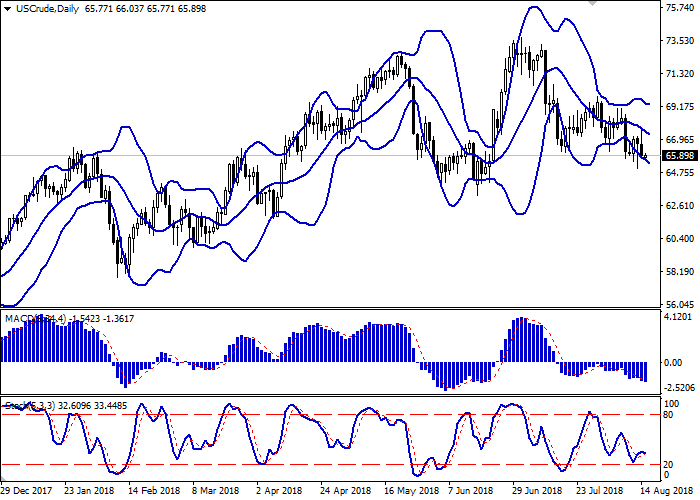
On the daily chart, Bollinger bands are steadily declining. The price range slightly widens from below, letting the "bears" renew local lows. MACD indicator decreases, keeping a weak sell signal (the histogram is below the signal line).
Stochastic, rebounded from the level of 20, tends to turn downwards again.
The indicators reflect the possibility of further development of the "bearish" trend in the short and/or ultra-short term.
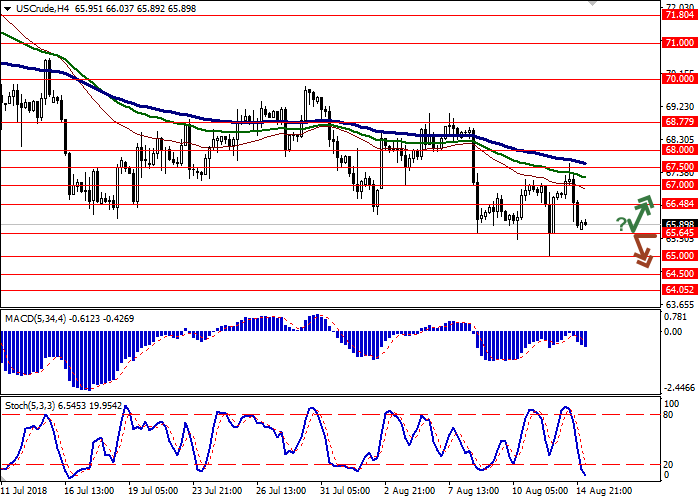
Resistance levels: 66.48, 67.00, 67.50, 68.00.
Support levels: 65.64, 65.00, 64.50, 64.05.
Trading tips
Long positions can be opened after a rebound from the level of 65.64 and breakout of the level of 66.48 upward with the target at 67.50 or 68.00. Stop loss is 65.64, 65.50.
Short positions can be opened after a breakdown of the level of 65.64 with a target at 64.50 or 64.05. Stop loss is 66.48.
Implementation period: 2–3 days.
Yesterday, oil prices declined, despite the fact that during the day they traded in an upward direction due to OPEC reports that Saudi Arabia reduced production by 52.8 thousand barrels per day, bringing it to 10.387 million barrels per day in July. Saudi Arabia reported an even greater reduction by 200.5 thousand barrels per day.
At the end of the afternoon session, investors began to close profitable positions, and API Weekly Crude Oil Stock release pulled it downwards. It increased by 3.66 million barrels after a decrease of 6 million barrels over the previous period.
On Wednesday, investors wait for EIA Weekly Crude Oil Stock release. Earlier, the forecast assumed a decrease by 2.667 million barrels, but given the API statistics, the actual dynamics may differ significantly.
Support and resistance
On the daily chart, Bollinger bands are steadily declining. The price range slightly widens from below, letting the "bears" renew local lows. MACD indicator decreases, keeping a weak sell signal (the histogram is below the signal line).
Stochastic, rebounded from the level of 20, tends to turn downwards again.
The indicators reflect the possibility of further development of the "bearish" trend in the short and/or ultra-short term.
Resistance levels: 66.48, 67.00, 67.50, 68.00.
Support levels: 65.64, 65.00, 64.50, 64.05.
Trading tips
Long positions can be opened after a rebound from the level of 65.64 and breakout of the level of 66.48 upward with the target at 67.50 or 68.00. Stop loss is 65.64, 65.50.
Short positions can be opened after a breakdown of the level of 65.64 with a target at 64.50 or 64.05. Stop loss is 66.48.
Implementation period: 2–3 days.


No comments:
Write comments