
WTI Crude Oil: general analysis
23 August 2018, 14:08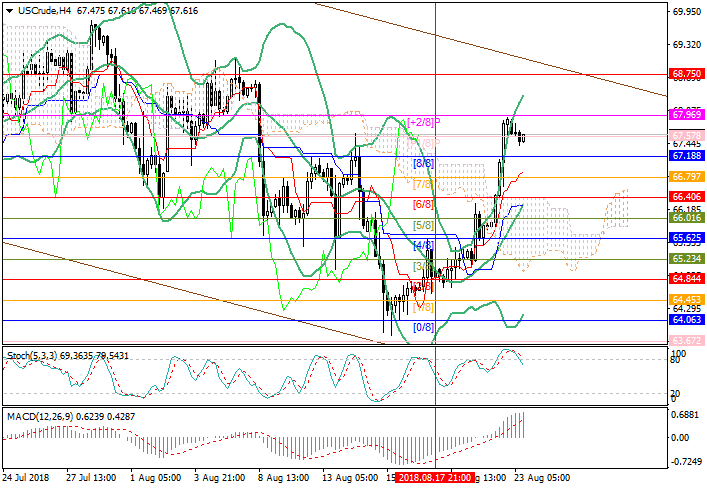
| Scenario | |
|---|---|
| Timeframe | Intraday |
| Recommendation | SELL STOP |
| Entry Point | 67.10 |
| Take Profit | 66.40 |
| Stop Loss | 67.40 |
| Key Levels | 66.40, 67.18, 67.98, 68.75 |
| Alternative scenario | |
|---|---|
| Recommendation | BUY STOP |
| Entry Point | 68.00 |
| Take Profit | 68.75 |
| Stop Loss | 67.50 |
| Key Levels | 66.40, 67.18, 67.98, 68.75 |
Current trend
This week, oil prices rose significantly and reached the level of 67.90 on Wednesday, supported by a sharp reduction in US energy supplies. On Tuesday, API report reflected a decreased by 5.17 million, and on Wednesday the EIA report confirmed a drop of 5.836 million barrels. At the same time gasoline stocks increased by 1,200 million, and stocks of distillates – by 1,849 million barrels.
Today, the price is in the downward correction due to the US and China introduction of mutual duties worth $16 billion. Washington raised tariffs for motorcycles, railway cars and steam turbines produced in China. The PRC responded with taxes on American cars, buses, coal and other goods.
The price is under pressure due to the news that Saudi state company Saudi Aramco entering IPO is postponed for an indefinite period. The Saudi government expects more favorable market conditions and the completion of legal preparations for the initial trade.
Support and resistance
The key “bearish” level is 67.18 (Murrey [8/8]). In case of breakdown, the price can decrease to the level of 66.40 (Murrey [6/8], the middle Bollinger band line). A breakout above 67.96 (Murrey [+2/8]) may cause a rise to the level of 68.75 (Murrey [4/8], D1).
Technical indicators reflect the possibility of correction within the uptrend. Stochastic leaves the overbought zone, forming a sell signal. MACD histogram stabilized in the positive area.
Resistance levels: 67.98, 68.75.
Support levels: 67.18, 66.40.

Trading tips
Short positions can be opened below the level of 67.18 with the target at 66.40 and stop loss 67.40.
Long positions can be opened above the level of 67.96 with the target at 68.75 and a stop loss in the area of 67.50.
Implementation period: 3–5 days.
This week, oil prices rose significantly and reached the level of 67.90 on Wednesday, supported by a sharp reduction in US energy supplies. On Tuesday, API report reflected a decreased by 5.17 million, and on Wednesday the EIA report confirmed a drop of 5.836 million barrels. At the same time gasoline stocks increased by 1,200 million, and stocks of distillates – by 1,849 million barrels.
Today, the price is in the downward correction due to the US and China introduction of mutual duties worth $16 billion. Washington raised tariffs for motorcycles, railway cars and steam turbines produced in China. The PRC responded with taxes on American cars, buses, coal and other goods.
The price is under pressure due to the news that Saudi state company Saudi Aramco entering IPO is postponed for an indefinite period. The Saudi government expects more favorable market conditions and the completion of legal preparations for the initial trade.
Support and resistance
The key “bearish” level is 67.18 (Murrey [8/8]). In case of breakdown, the price can decrease to the level of 66.40 (Murrey [6/8], the middle Bollinger band line). A breakout above 67.96 (Murrey [+2/8]) may cause a rise to the level of 68.75 (Murrey [4/8], D1).
Technical indicators reflect the possibility of correction within the uptrend. Stochastic leaves the overbought zone, forming a sell signal. MACD histogram stabilized in the positive area.
Resistance levels: 67.98, 68.75.
Support levels: 67.18, 66.40.
Trading tips
Short positions can be opened below the level of 67.18 with the target at 66.40 and stop loss 67.40.
Long positions can be opened above the level of 67.96 with the target at 68.75 and a stop loss in the area of 67.50.
Implementation period: 3–5 days.


No comments:
Write comments