
USD/JPY: change of tendency
23 August 2018, 14:34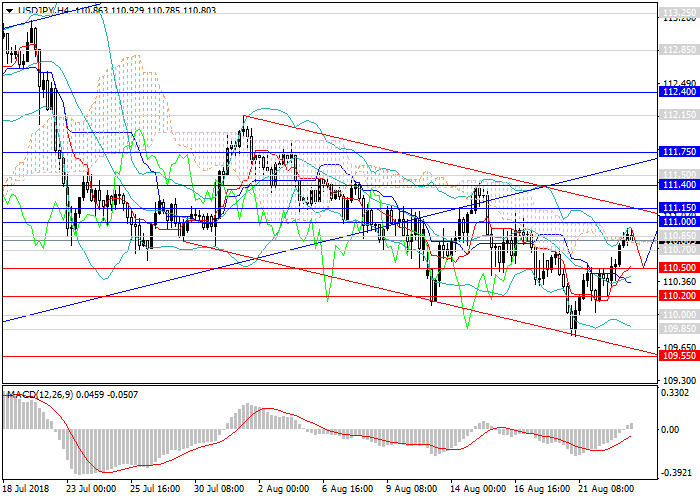
| Scenario | |
|---|---|
| Timeframe | Weekly |
| Recommendation | BUY |
| Entry Point | 110.76 |
| Take Profit | 111.75, 112.15, 112.40 |
| Stop Loss | 110.20 |
| Key Levels | 109.30, 109.55, 109.85, 110.00, 110.50, 110.70, 111.00, 111.15, 111.40, 111.50, 111.75, 112.15, 112.40 |
Current trend
The US dollar again began to dominate against major currencies, including the yen.
In August, the pair declined within the broad descending channel and lost more than 200 points during that time, reaching a local low of 109.80. Later, the instrument reversed in view of increased demand for USD and the release of weak data from Japan. This week, the pair is growing and has regained more than 100 points.
At the end of the week, a number of key releases for the USA will be published: data on the labor market, the construction market, and orders for durable goods.
Support and resistance
The pair is still in a downward trend, gradually moving to its upper border, the level of 111.15. But this movement can be viewed as a protracted downward correction due to the high potential of the dollar's growth amid the acceleration of the US economic growth and the release of strong data in its main sectors. Therefore, there's a high probability of forming a long ascending wave, taking the upper border of the channel, and returning to an uptrend.
Technical indicators on H4 chart and above confirm the forecast: MACD indicates a rapid decline in the volume of short positions, Bollinger Bands are directed upwards.
Support levels: 110.70, 110.50, 110.20, 110.00, 109.85, 109.55, 109.30.
Resistance levels: 111.00, 111.15, 111.40, 111.50, 111.75, 112.15, 112.40.

Trading tips
In this situation, long positions may be opened from the current level with targets at 111.75, 112.15, 112.40 and stop loss at 110.20.
The US dollar again began to dominate against major currencies, including the yen.
In August, the pair declined within the broad descending channel and lost more than 200 points during that time, reaching a local low of 109.80. Later, the instrument reversed in view of increased demand for USD and the release of weak data from Japan. This week, the pair is growing and has regained more than 100 points.
At the end of the week, a number of key releases for the USA will be published: data on the labor market, the construction market, and orders for durable goods.
Support and resistance
The pair is still in a downward trend, gradually moving to its upper border, the level of 111.15. But this movement can be viewed as a protracted downward correction due to the high potential of the dollar's growth amid the acceleration of the US economic growth and the release of strong data in its main sectors. Therefore, there's a high probability of forming a long ascending wave, taking the upper border of the channel, and returning to an uptrend.
Technical indicators on H4 chart and above confirm the forecast: MACD indicates a rapid decline in the volume of short positions, Bollinger Bands are directed upwards.
Support levels: 110.70, 110.50, 110.20, 110.00, 109.85, 109.55, 109.30.
Resistance levels: 111.00, 111.15, 111.40, 111.50, 111.75, 112.15, 112.40.
Trading tips
In this situation, long positions may be opened from the current level with targets at 111.75, 112.15, 112.40 and stop loss at 110.20.


No comments:
Write comments