
NZD/USD: the pair remains under pressure
13 August 2018, 10:51
| Scenario | |
|---|---|
| Timeframe | Intraday |
| Recommendation | BUY STOP |
| Entry Point | 0.6610 |
| Take Profit | 0.6686, 0.6712 |
| Stop Loss | 0.6550 |
| Key Levels | 0.6500, 0.6534, 0.6560, 0.6600, 0.6622, 0.6650, 0.6686 |
| Alternative scenario | |
|---|---|
| Recommendation | SELL STOP |
| Entry Point | 0.6555 |
| Take Profit | 0.6500, 0.6480 |
| Stop Loss | 0.6600 |
| Key Levels | 0.6500, 0.6534, 0.6560, 0.6600, 0.6622, 0.6650, 0.6686 |
Current trend
The pair finished last week with a steady decline, having updated its record low of March 2016.
US July inflation data were ambiguous. Instead of the expected growth, CPI stayed at the level of 2.9%, and the base CPI rose from 2.3% to 2.4%, which keeps investors confident that the Fed will increase the interest rate two times this year, the nearest growth may be in September.
As for the trade war news, China refused to imply increased taxes on the US crude oil supply. Probably, there is nothing to compensate for its PRC yet. However, the increase in tariffs will affect imported from the US diesel fuel, gasoline and propane.
Friday stats from New Zealand failed to provide tangible support. In particular, the index of business activity in the manufacturing sector in July fell from 52.7 to 51.2 points.
Support and resistance
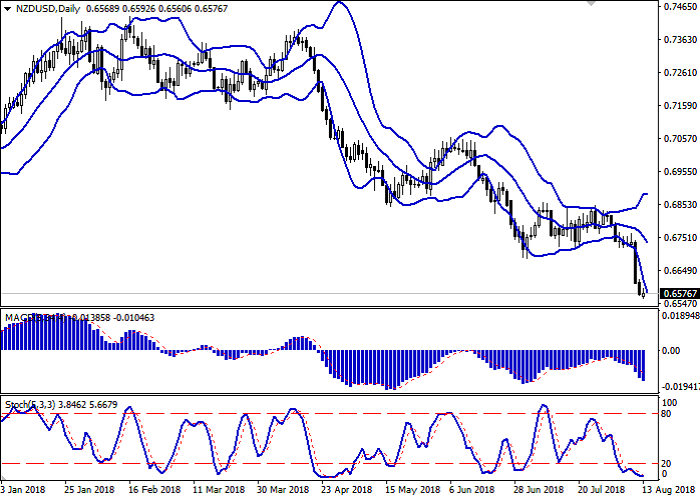
Bollinger bands on the daily chart are directed downwards. The price range is expanding in the lower part, but not as fast as the development of the "bearish" dynamics.
The MACD indicator decreases, keeping the sell signal (the histogram is located below the signal line).
Stochastic turned sideways in the oversold zone, which indicates the possibility of a corrective growth.
Resistance levels: 0.6600, 0.6622, 0.6650, 0.6686.
Support levels: 0.6560, 0.6534, 0.6500.
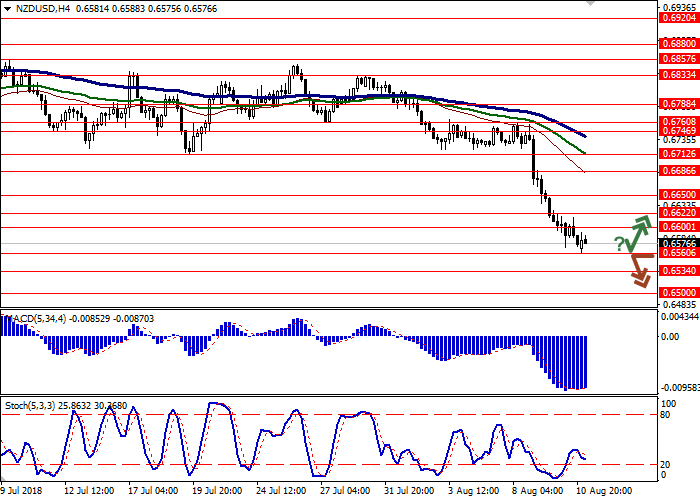
Trading tips
To open long positions, you can rely on the breakout of the level of 0.6600. Take profit – 0.6686 or 0.6712. Stop loss – 0.6550. Term of realization: 2-3 days.
A confident breakdown of 0.6560 can be a signal for further sales with targets of 0.6500 and 0.6480. The stop loss is 0.6600. Term of realization: 2-3 days.
The pair finished last week with a steady decline, having updated its record low of March 2016.
US July inflation data were ambiguous. Instead of the expected growth, CPI stayed at the level of 2.9%, and the base CPI rose from 2.3% to 2.4%, which keeps investors confident that the Fed will increase the interest rate two times this year, the nearest growth may be in September.
As for the trade war news, China refused to imply increased taxes on the US crude oil supply. Probably, there is nothing to compensate for its PRC yet. However, the increase in tariffs will affect imported from the US diesel fuel, gasoline and propane.
Friday stats from New Zealand failed to provide tangible support. In particular, the index of business activity in the manufacturing sector in July fell from 52.7 to 51.2 points.
Support and resistance
Bollinger bands on the daily chart are directed downwards. The price range is expanding in the lower part, but not as fast as the development of the "bearish" dynamics.
The MACD indicator decreases, keeping the sell signal (the histogram is located below the signal line).
Stochastic turned sideways in the oversold zone, which indicates the possibility of a corrective growth.
Resistance levels: 0.6600, 0.6622, 0.6650, 0.6686.
Support levels: 0.6560, 0.6534, 0.6500.
Trading tips
To open long positions, you can rely on the breakout of the level of 0.6600. Take profit – 0.6686 or 0.6712. Stop loss – 0.6550. Term of realization: 2-3 days.
A confident breakdown of 0.6560 can be a signal for further sales with targets of 0.6500 and 0.6480. The stop loss is 0.6600. Term of realization: 2-3 days.


No comments:
Write comments