
Facebook Inc. (FB/NASD): general review
09 August 2018, 12:08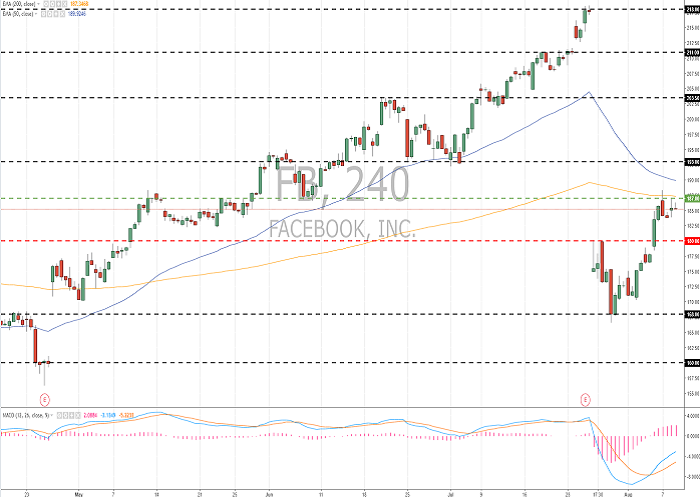
| Scenario | |
|---|---|
| Timeframe | Intraday |
| Recommendation | BUY STOP |
| Entry Point | 187.10 |
| Take Profit | 192.00, 197.00, 200.00 |
| Stop Loss | 182.00 |
| Key Levels | 160.00, 168.00, 180.00, 187.00, 193.00, 203.50 |
| Alternative scenario | |
|---|---|
| Recommendation | SELL STOP |
| Entry Point | 179.90 |
| Take Profit | 171.00, 168.00 |
| Stop Loss | 185.00 |
| Key Levels | 160.00, 168.00, 180.00, 187.00, 193.00, 203.50 |
Current trend
Shares of Facebook fell by 27% after the publication of ambiguous financial results for Q2 2018 and have been trying to recapture lost ground since the beginning of last week. The company showed revenue growth of 42% YoY to USD 13.23 billion, net income per share increased by 32% YoY to USD 1.74. A number of key indicators below market expectations, including advertising revenue of USD 13.03 billion compared to expectations of USD 13.16 billion put pressure on the shares. Indicators of the number of daily active users (1.47 billion) and monthly active users (2.23 billion) also fell short of analysts' expectations of 1.49 billion and 2.25 billion respectively.
During the previous week Facebook shares grew by 7.88%. S&P 500 went up by 1.56% within the same period.
Support and resistance
The stock of the company is showing an ambiguous technical picture. At the moment, #FB quotes are consolidating after a significant fall in late July. Indicators show controversial signals: the price is below MA (50) and MA (200); MACD histogram is in the positive zone. Positions are to be opened from key levels.
Comparing company's multiplier with its competitors, we can say that #FB shares are undervalued.
Resistance levels: 187.00, 193.00, 203.50.
Support levels: 180.00, 168.00, 160.00.

Trading tips
If the price consolidates above 187.00, one should expect the company's shares to resume. Potential profits should be locked in by orders at 192.00, 197.00 and 200.00. Stop loss — 182.00.
If the price consolidates below the support level of 180.00, one may consider selling #FB. The movement potential is aimed in the area of 171.00–168.00. Stop loss — 185.00.
Implementation period: 3 days.
Shares of Facebook fell by 27% after the publication of ambiguous financial results for Q2 2018 and have been trying to recapture lost ground since the beginning of last week. The company showed revenue growth of 42% YoY to USD 13.23 billion, net income per share increased by 32% YoY to USD 1.74. A number of key indicators below market expectations, including advertising revenue of USD 13.03 billion compared to expectations of USD 13.16 billion put pressure on the shares. Indicators of the number of daily active users (1.47 billion) and monthly active users (2.23 billion) also fell short of analysts' expectations of 1.49 billion and 2.25 billion respectively.
During the previous week Facebook shares grew by 7.88%. S&P 500 went up by 1.56% within the same period.
Support and resistance
The stock of the company is showing an ambiguous technical picture. At the moment, #FB quotes are consolidating after a significant fall in late July. Indicators show controversial signals: the price is below MA (50) and MA (200); MACD histogram is in the positive zone. Positions are to be opened from key levels.
Comparing company's multiplier with its competitors, we can say that #FB shares are undervalued.
Resistance levels: 187.00, 193.00, 203.50.
Support levels: 180.00, 168.00, 160.00.
Trading tips
If the price consolidates above 187.00, one should expect the company's shares to resume. Potential profits should be locked in by orders at 192.00, 197.00 and 200.00. Stop loss — 182.00.
If the price consolidates below the support level of 180.00, one may consider selling #FB. The movement potential is aimed in the area of 171.00–168.00. Stop loss — 185.00.
Implementation period: 3 days.


No comments:
Write comments