
eBay Inc. (EBAY/NASD): general analysis
23 August 2018, 11:36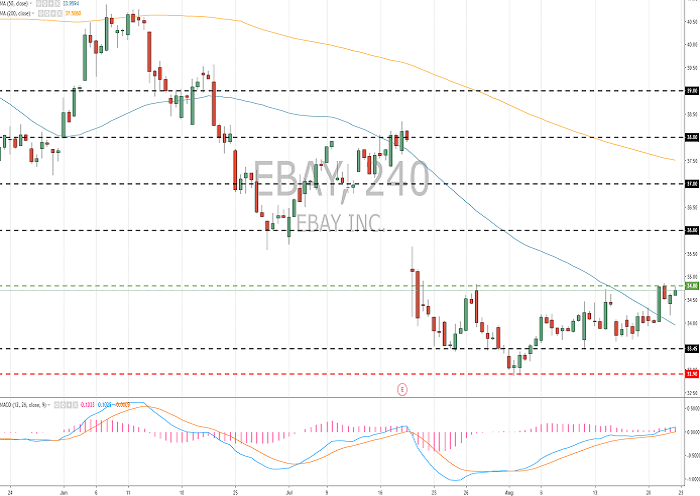
| Scenario | |
|---|---|
| Timeframe | Intraday |
| Recommendation | BUY STOP |
| Entry Point | 34.90 |
| Take Profit | 36.00, 37.00, 37.50 |
| Stop Loss | 33.80 |
| Key Levels | 32.00, 32.90, 33.45, 34.80, 36.00, 37.00 |
| Alternative scenario | |
|---|---|
| Recommendation | SELL STOP |
| Entry Point | 32.80 |
| Take Profit | 31.00, 30.50 |
| Stop Loss | 33.90 |
| Key Levels | 32.00, 32.90, 33.45, 34.80, 36.00, 37.00 |
Current trend
The shares of eBay fell by almost 25% from January 52-week high and are now trading near the annual minimum. Following the publication of the ambiguous Q2 financial report, Wall Street analysts decreased the company's Q3 forecast, *** 2% growth in earnings per share expectations and 2.5% growth forecast. In addition, according to the results of 2018, expectations for growth in eBay revenue were reduced by 1.6%.
During the last week, eBay grew 2.48% against the growth of the S&P 500 index by 1.54%.
Support and resistance
The technical picture reflects a possible correction of the company's shares after a long-term decline. The price is now testing the key resistance level of 34.80. The level of 33.45 is local support. MACD indicator moved to the positive zone and continues to rise, which indicates the strength of the buyers. It is better to buy the stocks in the near future.
The comparative analysis of the indicators of the company and its competitors suggests that the shares are underpriced.
Resistance levels: 34.80, 36.00, 37.00.
Support levels: 33.45, 32.90, 32.00.

Trading tips
Long positions can be opened after the price is fixed above the level of 34.80. The closing of the profitable positions is possible at the levels of 36.00, 37.00 and 37.50. Stop loss is 33.80.
Short positions can be opened after the price is set below the level of 32.90 with the targets at 31.00–30.50. Stop loss is 33.90.
Implementation period: 3 days.
The shares of eBay fell by almost 25% from January 52-week high and are now trading near the annual minimum. Following the publication of the ambiguous Q2 financial report, Wall Street analysts decreased the company's Q3 forecast, *** 2% growth in earnings per share expectations and 2.5% growth forecast. In addition, according to the results of 2018, expectations for growth in eBay revenue were reduced by 1.6%.
During the last week, eBay grew 2.48% against the growth of the S&P 500 index by 1.54%.
Support and resistance
The technical picture reflects a possible correction of the company's shares after a long-term decline. The price is now testing the key resistance level of 34.80. The level of 33.45 is local support. MACD indicator moved to the positive zone and continues to rise, which indicates the strength of the buyers. It is better to buy the stocks in the near future.
The comparative analysis of the indicators of the company and its competitors suggests that the shares are underpriced.
Resistance levels: 34.80, 36.00, 37.00.
Support levels: 33.45, 32.90, 32.00.
Trading tips
Long positions can be opened after the price is fixed above the level of 34.80. The closing of the profitable positions is possible at the levels of 36.00, 37.00 and 37.50. Stop loss is 33.80.
Short positions can be opened after the price is set below the level of 32.90 with the targets at 31.00–30.50. Stop loss is 33.90.
Implementation period: 3 days.


No comments:
Write comments