
Caterpillar Inc. (CAT/NYSE): general analysis
08 August 2018, 13:29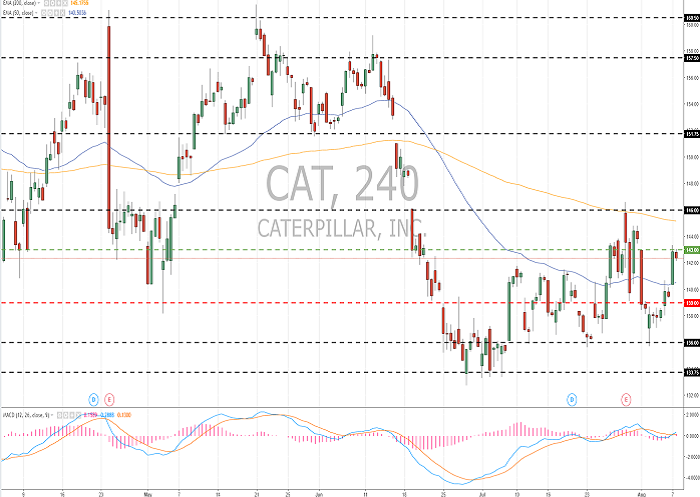
| Scenario | |
|---|---|
| Timeframe | Intraday |
| Recommendation | BUY STOP |
| Entry Point | 143.10 |
| Take Profit | 146.00, 149.00, 151.50 |
| Stop Loss | 140.00 |
| Key Levels | 133.75, 136.00, 139.00, 143.00, 146.00, 151.75 |
| Alternative scenario | |
|---|---|
| Recommendation | SELL STOP |
| Entry Point | 138.90 |
| Take Profit | 134.00, 132.00 |
| Stop Loss | 142.00 |
| Key Levels | 133.75, 136.00, 139.00, 143.00, 146.00, 151.75 |
Current trend
At the beginning of last week, Caterpillar published a strong Q2 financial report. The issuer's quotes reacted with a gap-drop, after which the expected growth is observed. The corrected earnings per share increased almost twice YoY to 2.97 US dollars, 12% higher than the market’s expectations. Revenues grew by 24% YoY to $14 billion, also exceeding the forecasts. Based on strong results of the first half of the year, the company expects corrected earnings per share to be at the level of 11–12 USD against to the previous forecast of 10.25–11.25.
During the last week, Caterpillar decreased by 0.99% against the growth of S&P 500 index by 1.49%.
Support and resistance
Since the beginning of this month, trades are very active, but the trend is ambiguous. The stocks are moving sideways. The issuer is testing local support and resistance levels at 139.00 and 143.00. The instrument has the potential to recover. Indicators do not give a clear signal: the price consolidated between MA (50) and MA (200); MACD histogram is near the zero line. It is better to open the positions from the key levels.
The comparative analysis of the indicators of the company and its competitors suggests the neutrality of its share prices.
Resistance levels: 143.00, 146.00, 151.75.
Support levels: 139.00, 136.00, 133.75.

Trading tips
Long positions can be opened after the price is fixed above the level of 143.00. The closing of the profitable positions is possible at the levels of 146.00, 149.00 and 151.50. Stop loss is 140.00.
Short positions can be opened after the price is set below the level of 139.00 with the targets of 134.00–132.00. Stop loss is 142.00.
Implementation period: 3 days.
At the beginning of last week, Caterpillar published a strong Q2 financial report. The issuer's quotes reacted with a gap-drop, after which the expected growth is observed. The corrected earnings per share increased almost twice YoY to 2.97 US dollars, 12% higher than the market’s expectations. Revenues grew by 24% YoY to $14 billion, also exceeding the forecasts. Based on strong results of the first half of the year, the company expects corrected earnings per share to be at the level of 11–12 USD against to the previous forecast of 10.25–11.25.
During the last week, Caterpillar decreased by 0.99% against the growth of S&P 500 index by 1.49%.
Support and resistance
Since the beginning of this month, trades are very active, but the trend is ambiguous. The stocks are moving sideways. The issuer is testing local support and resistance levels at 139.00 and 143.00. The instrument has the potential to recover. Indicators do not give a clear signal: the price consolidated between MA (50) and MA (200); MACD histogram is near the zero line. It is better to open the positions from the key levels.
The comparative analysis of the indicators of the company and its competitors suggests the neutrality of its share prices.
Resistance levels: 143.00, 146.00, 151.75.
Support levels: 139.00, 136.00, 133.75.
Trading tips
Long positions can be opened after the price is fixed above the level of 143.00. The closing of the profitable positions is possible at the levels of 146.00, 149.00 and 151.50. Stop loss is 140.00.
Short positions can be opened after the price is set below the level of 139.00 with the targets of 134.00–132.00. Stop loss is 142.00.
Implementation period: 3 days.


No comments:
Write comments