
Apple Inc.: wave analysis
23 August 2018, 09:36
| Scenario | |
|---|---|
| Timeframe | Weekly |
| Recommendation | BUY |
| Entry Point | 215.13 |
| Take Profit | 230.00, 236.00 |
| Stop Loss | 204.40 |
| Key Levels | 195.30, 200.00, 204.40, 230.00, 236.00 |
| Alternative scenario | |
|---|---|
| Recommendation | SELL STOP |
| Entry Point | 204.30 |
| Take Profit | 200.00, 195.30 |
| Stop Loss | 205.80 |
| Key Levels | 195.30, 200.00, 204.40, 230.00, 236.00 |
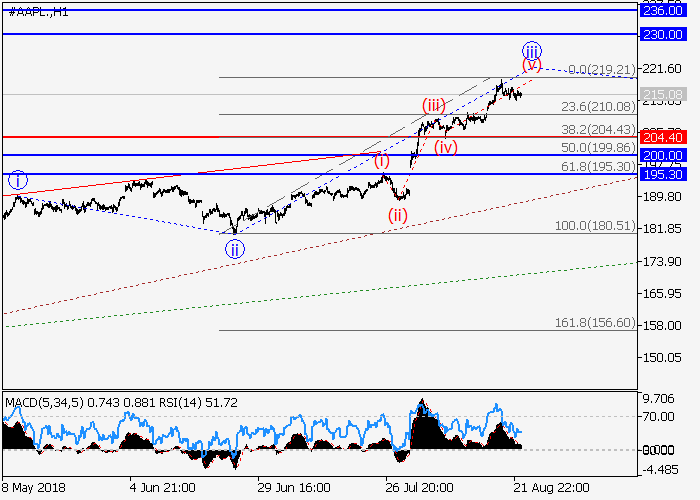
The trend is upward.
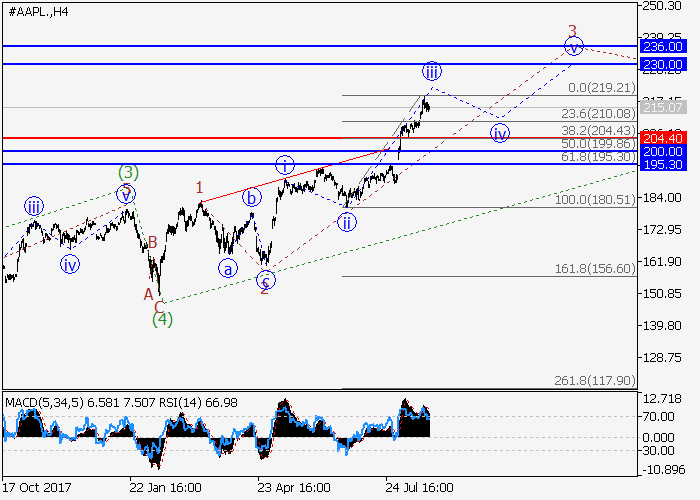
On the 4-hour chart, the fifth wave (5) of the higher level develops. Now the third wave of the lower level 3 of (5) is forming, within which the wave iii of 5 is ending. If the assumption is correct, after the end of the correction iv of 5, the price will grow to the area of 230.00–236.00. The level of 204.40 is critical and stop loss for this scenario.
Main scenario
Long positions will become relevant after the end of the correction, above the level of 204.40 with the targets at 230.00–236.00. Implementation period: 7 days and more.
Alternative scenario
The breakdown and the consolidation of the price below the level of 204.40 will let the price go down to the levels of 200.00–195.30.


No comments:
Write comments