
XAU/USD: technical analysis
14 May 2018, 13:16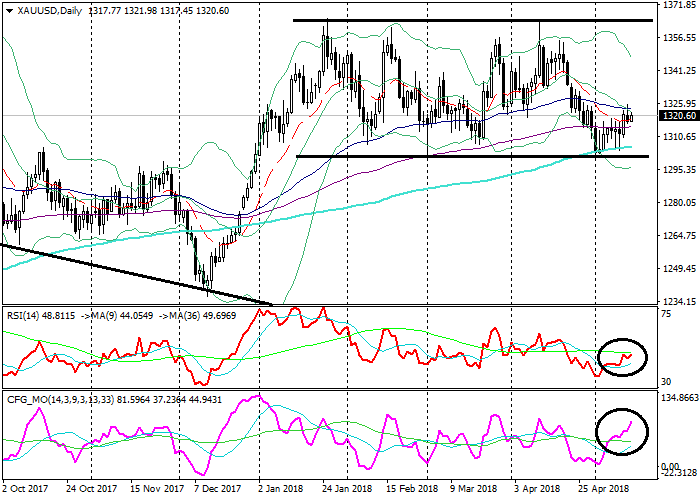
| Scenario | |
|---|---|
| Timeframe | Weekly |
| Recommendation | BUY STOP |
| Entry Point | 1325.00 |
| Take Profit | 1340.00, 1365.00 |
| Stop Loss | 1315.00 |
| Key Levels | 1277.00, 1295.00, 1300.00, 1325.00, 1340.00, 1365.00 |
| Alternative scenario | |
|---|---|
| Recommendation | SELL STOP |
| Entry Point | 1295.00 |
| Take Profit | 1277.00 |
| Stop Loss | 1303.00 |
| Key Levels | 1277.00, 1295.00, 1300.00, 1325.00, 1340.00, 1365.00 |
XAU/USD, D1
On the daily chart, the instrument is trading on the middle MA of the Bollinger Bands. The price remains on the level with its moving averages that are horizontal. The RSI is testing from below its longer MA. The Composite is growing, having broken out its longer MA.

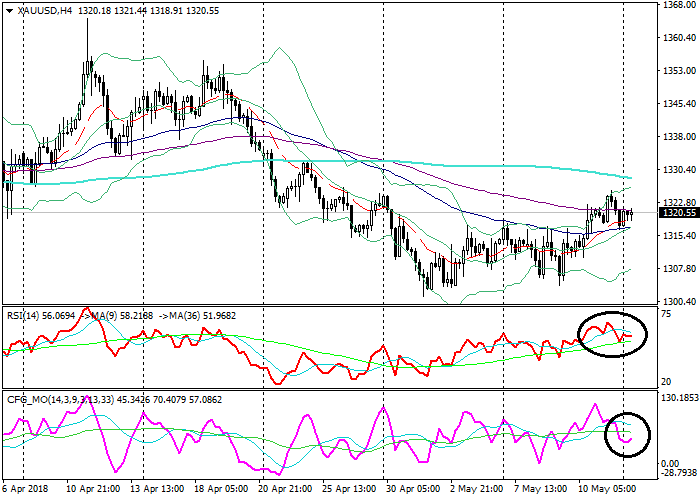
XAU/USD, H4
On the 4-hour chart, the instrument is trading in the upper Bollinger band. The price remains on the level with the EMA65, EMA130 that start running up and slightly below the SMA200, which is horizontal. The RSI is testing from above its longer MA. The Composite is about to test from below its longer MA.
Key levels
Support levels: 1300.00 (local lows), 1295.00 (June 2017 highs), 1277.00 (April 2014 lows).
Resistance levels: 1325.00 (local highs), 1340.00 (local highs), 1365.00 (April highs).
Trading tips
The price keeps trading in a sideways channel, having bounced off its lower border. The growth is likely to continue.
Long positions can be opened from the level of 1325.00 with targets at 1340.00, 1365.00 and stop-loss at 1315.00. Validity – 3-5 days.
Short positions can be opened from the level of 1295.00 with the target at 1277.00 and stop-loss at 1303.00. Validity – 3-5 days.
On the daily chart, the instrument is trading on the middle MA of the Bollinger Bands. The price remains on the level with its moving averages that are horizontal. The RSI is testing from below its longer MA. The Composite is growing, having broken out its longer MA.
XAU/USD, H4
On the 4-hour chart, the instrument is trading in the upper Bollinger band. The price remains on the level with the EMA65, EMA130 that start running up and slightly below the SMA200, which is horizontal. The RSI is testing from above its longer MA. The Composite is about to test from below its longer MA.
Key levels
Support levels: 1300.00 (local lows), 1295.00 (June 2017 highs), 1277.00 (April 2014 lows).
Resistance levels: 1325.00 (local highs), 1340.00 (local highs), 1365.00 (April highs).
Trading tips
The price keeps trading in a sideways channel, having bounced off its lower border. The growth is likely to continue.
Long positions can be opened from the level of 1325.00 with targets at 1340.00, 1365.00 and stop-loss at 1315.00. Validity – 3-5 days.
Short positions can be opened from the level of 1295.00 with the target at 1277.00 and stop-loss at 1303.00. Validity – 3-5 days.


No comments:
Write comments