
XAU/USD: price is slightly growing
24 May 2018, 09:58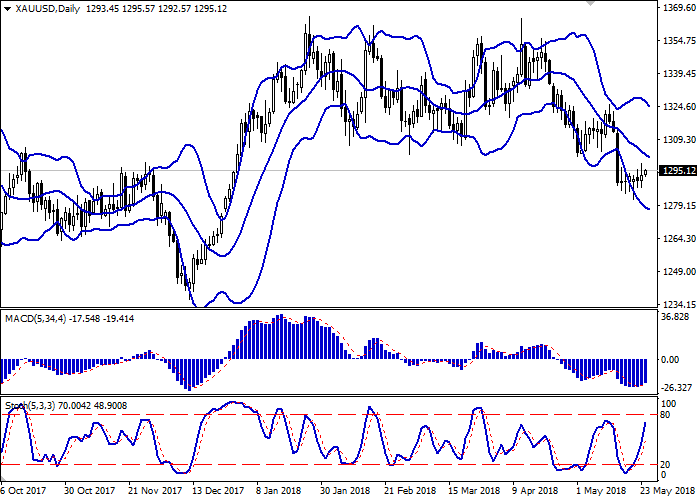
| Scenario | |
|---|---|
| Timeframe | Intraday |
| Recommendation | BUY STOP |
| Entry Point | 1300.10, 1301.50 |
| Take Profit | 1312.48, 1317.17 |
| Stop Loss | 1294.00 |
| Key Levels | 1276.87, 1281.73, 1287.60, 1292.00, 1301.40, 1306.70, 1312.48, 1317.17 |
| Alternative scenario | |
|---|---|
| Recommendation | SELL STOP |
| Entry Point | 1291.90, 1287.50 |
| Take Profit | 1281.73 |
| Stop Loss | 1295.00, 1298.00 |
| Key Levels | 1276.87, 1281.73, 1287.60, 1292.00, 1301.40, 1306.70, 1312.48, 1317.17 |
Current trend
Yesterday, gold prices grew slightly, despite the dominating of “bearish” moods. The instrument is under pressure of the strengthening dollar, which balances the support of the tense trade negotiations between the US and China.
After FOMC Minutes publication, USD began to weaken, as the regulator said that it would not rush to raise interest rates even after reaching the target inflation levels.
The further fall of the US currency was prevented by positive macroeconomic statistics: May Markit Services PMI increased from 54.6 to 55.7 points with a forecast of 54.9 points. The corresponding Manufacturing PMI rose from 56.5 to 56.6 points, while it was expected to stay on the same level.
Support and resistance
On the daily chart, Bollinger bands are moderately falling. The price range is narrowing, reflecting a change in the trade direction in the short/medium term. MACD reversed upwards, forming a buy signal (the histogram is above the signal line). Stochastic is actively growing, reaching its highs, which reflects that gold is overbought.
It is better to keep current long positions in the short and/or very short term.
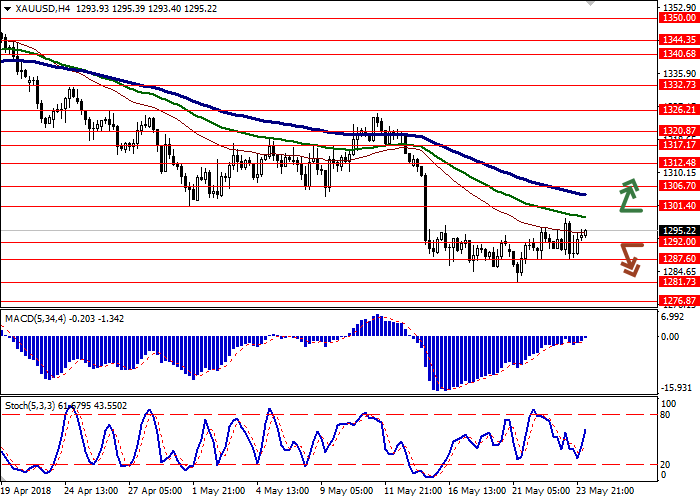
Resistance levels: 1301.40, 1306.70, 1312.48, 1317.17.
Support levels: 1292.00, 1287.60, 1281.73, 1276.87.

Trading tips
Long positions can be opened after the breakout of the levels of 1300.00 or 1301.40 with the targets at 1312.48 or 1317.17 and stop loss 1294.00. Implementation period: 2–3 days.
Short positions can be opened after the breakdown of the levels of 1292.00 or 1287.60 with the target at 1281.73 and stop loss 1295.00 or 1298.00. Implementation period: 2 days.
Yesterday, gold prices grew slightly, despite the dominating of “bearish” moods. The instrument is under pressure of the strengthening dollar, which balances the support of the tense trade negotiations between the US and China.
After FOMC Minutes publication, USD began to weaken, as the regulator said that it would not rush to raise interest rates even after reaching the target inflation levels.
The further fall of the US currency was prevented by positive macroeconomic statistics: May Markit Services PMI increased from 54.6 to 55.7 points with a forecast of 54.9 points. The corresponding Manufacturing PMI rose from 56.5 to 56.6 points, while it was expected to stay on the same level.
Support and resistance
On the daily chart, Bollinger bands are moderately falling. The price range is narrowing, reflecting a change in the trade direction in the short/medium term. MACD reversed upwards, forming a buy signal (the histogram is above the signal line). Stochastic is actively growing, reaching its highs, which reflects that gold is overbought.
It is better to keep current long positions in the short and/or very short term.
Resistance levels: 1301.40, 1306.70, 1312.48, 1317.17.
Support levels: 1292.00, 1287.60, 1281.73, 1276.87.
Trading tips
Long positions can be opened after the breakout of the levels of 1300.00 or 1301.40 with the targets at 1312.48 or 1317.17 and stop loss 1294.00. Implementation period: 2–3 days.
Short positions can be opened after the breakdown of the levels of 1292.00 or 1287.60 with the target at 1281.73 and stop loss 1295.00 or 1298.00. Implementation period: 2 days.


No comments:
Write comments