
WTI Crude Oil: oil prices are going down
24 May 2018, 09:55
| Scenario | |
|---|---|
| Timeframe | Intraday |
| Recommendation | BUY LIMIT |
| Entry Point | 71.00 |
| Take Profit | 72.22, 72.50, 72.72 |
| Stop Loss | 70.60 |
| Key Levels | 68.77, 69.38, 70.00, 71.00, 71.80, 72.22, 72.72 |
| Alternative scenario | |
|---|---|
| Recommendation | SELL STOP |
| Entry Point | 70.90 |
| Take Profit | 70.00 |
| Stop Loss | 71.50, 71.60 |
| Key Levels | 68.77, 69.38, 70.00, 71.00, 71.80, 72.22, 72.72 |
Current trend
Oil prices showed negative dynamics on Wednesday, but by the end of the trading session, the instrument managed to win back most of the losses. However, pressure on prices is provided by news about a possible increase in oil production among the OPEC countries in the short term due to the likely decline in oil exports from Venezuela and Iran.
In addition, the impact on the quotes was made on Wednesday by the US Department of Energy's oil reserves report, according to which over the week for May 18, the stock levels in warehouses rose sharply by 5.778M barrels, while analysts expected a decline of 1.567M barrels. Over the past period, stocks showed a decrease of 1.404M barrels.
Support and resistance
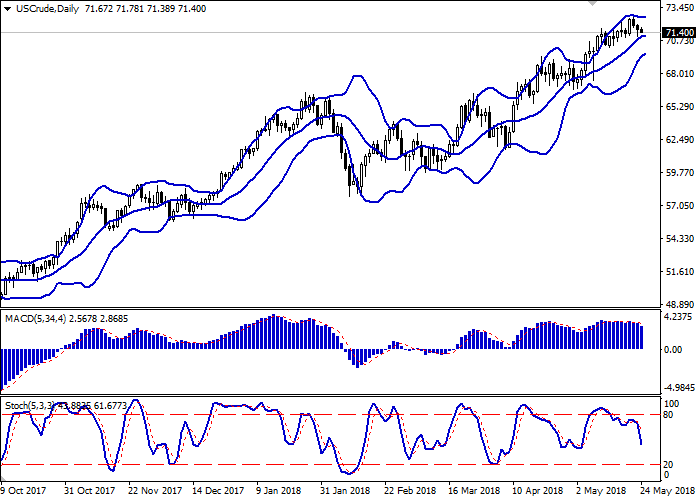
In the D1 chart Bollinger Bands demonstrate a tendency to reverse in a horizontal plane. The price range is narrowing, reflecting a change of trend in the short term.
MACD reversed downwards having formed a stable sell signal (histogram is located below the signal line).
Stochastic shows a similar dynamics, decreasing almost vertically. Currently, the indicator line is located approximately in the center of its working area, signaling the possible development of a "bearish" trend in the ultra-short term.
One should consider an opportunity to open new short positions in the short and/or ultra-short term.
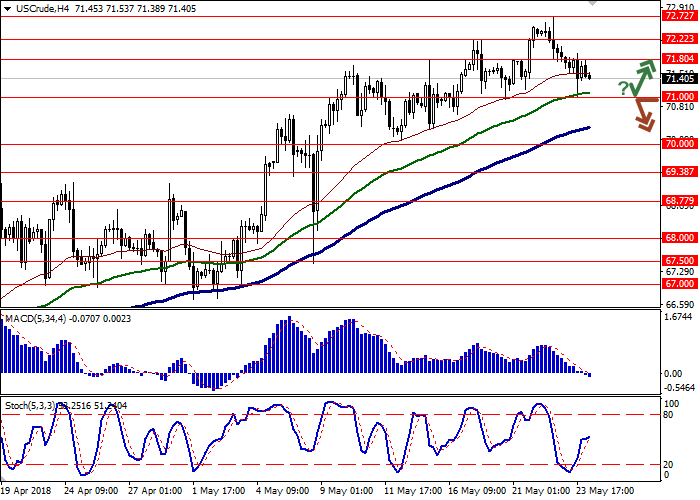
Resistance levels: 71.80, 72.22, 72.72.
Support levels: 71.00, 70.00, 69.38, 68.77.
Trading tips
To open long positions, one can rely on the rebound from the level of 71.00 as from support. Take-profit – 72.22 or 72.50, 72.72. Stop-loss – 70.60.
A breakdown of the level of 71.00 may be a signal for further sales with target at the psychological mark of 70.00. Stop-loss should be placed no further than 71.50–71.60.
Implementation period: 2-3 days.
Oil prices showed negative dynamics on Wednesday, but by the end of the trading session, the instrument managed to win back most of the losses. However, pressure on prices is provided by news about a possible increase in oil production among the OPEC countries in the short term due to the likely decline in oil exports from Venezuela and Iran.
In addition, the impact on the quotes was made on Wednesday by the US Department of Energy's oil reserves report, according to which over the week for May 18, the stock levels in warehouses rose sharply by 5.778M barrels, while analysts expected a decline of 1.567M barrels. Over the past period, stocks showed a decrease of 1.404M barrels.
Support and resistance
In the D1 chart Bollinger Bands demonstrate a tendency to reverse in a horizontal plane. The price range is narrowing, reflecting a change of trend in the short term.
MACD reversed downwards having formed a stable sell signal (histogram is located below the signal line).
Stochastic shows a similar dynamics, decreasing almost vertically. Currently, the indicator line is located approximately in the center of its working area, signaling the possible development of a "bearish" trend in the ultra-short term.
One should consider an opportunity to open new short positions in the short and/or ultra-short term.
Resistance levels: 71.80, 72.22, 72.72.
Support levels: 71.00, 70.00, 69.38, 68.77.
Trading tips
To open long positions, one can rely on the rebound from the level of 71.00 as from support. Take-profit – 72.22 or 72.50, 72.72. Stop-loss – 70.60.
A breakdown of the level of 71.00 may be a signal for further sales with target at the psychological mark of 70.00. Stop-loss should be placed no further than 71.50–71.60.
Implementation period: 2-3 days.


No comments:
Write comments