
XAG/USD: silver prices are growing
11 May 2018, 10:25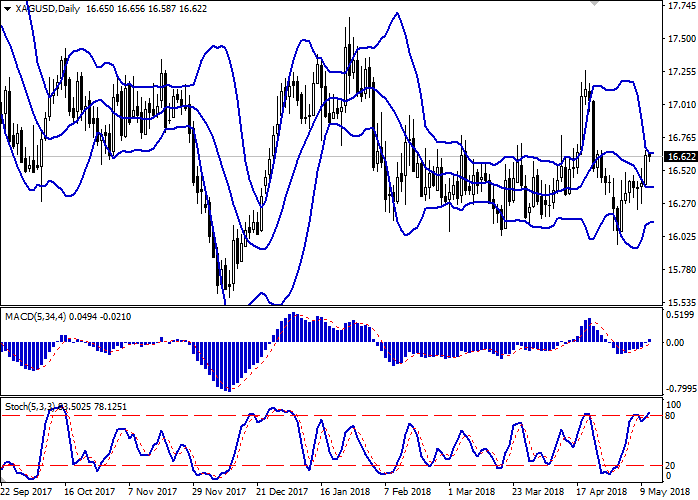
| Scenario | |
|---|---|
| Timeframe | Intraday |
| Recommendation | BUY STOP |
| Entry Point | 16.70 |
| Take Profit | 16.82, 16.92, 17.00 |
| Stop Loss | 16.50 |
| Key Levels | 16.20, 16.27, 16.44, 16.51, 16.66, 16.78, 16.82, 16.92, 17.00 |
| Alternative scenario | |
|---|---|
| Recommendation | SELL STOP |
| Entry Point | 16.50, 16.47 |
| Take Profit | 16.30, 16.27 |
| Stop Loss | 16.00 |
| Key Levels | 16.20, 16.27, 16.44, 16.51, 16.66, 16.78, 16.82, 16.92, 17.00 |
Current trend
Silver prices rose significantly on Thursday, recovering after several days of mixed trades, where "bearish" sentiment prevailed. Yesterday, the instrument was supported by weak statistics from the US, as well as increased demand for safe haven assets amid tension between the US and Iran.
The main pressure on Thursday was negative data on inflation in the US. In April, the consumer price index rose from 2.4% to 2.5% YoY but the base consumer price index, the target for interest rate changes, remained at the same level of 2.1% instead of the expected growth. This statistics, along with the latest mixed data from the US labor market, alarms investors, making them wary of slowing the pace of the Fed's key interest rate increase.
Support and resistance
Bollinger Bands in D1 chart demonstrate flat dynamics. The price range has also consolidated after the decline, outlining the approximate boundary of the short-term/medium-term flat corridor.
MACD indicator is growing preserving a buy signal (locating above the signal line) and is trying to gain a foothold above the zero mark.
Stochastic retains upward direction, but is located near its maximum levels, which indicates overbought silver in the ultra-short term.
Technical indicators remain contradictory; therefore, to open new positions, it is necessary to wait for clarification of the situation.
Resistance levels: 16.66, 16.78, 16.82, 16.92, 17.00.
Support levels: 16.51, 16.44, 16.27, 16.20.

Trading tips
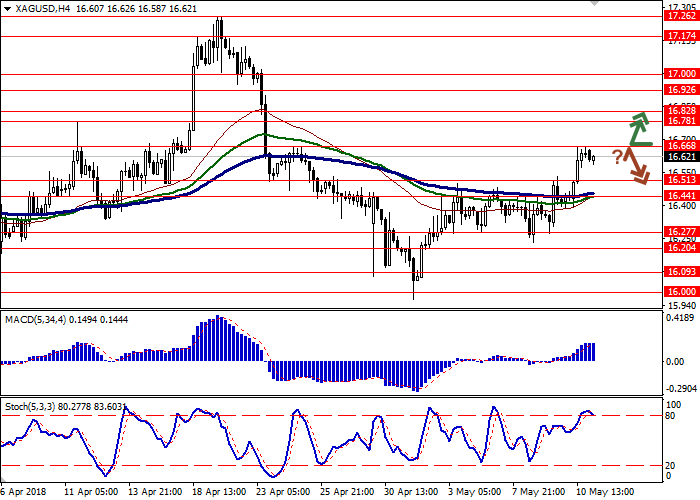
To open long positions one can rely on the breakout of the resistance level of 16.66, while maintaining "bullish" signals from technical indicators. Take-profit — 16.82 or 16.92, 17.00. Stop-loss – 16.50. Implementation period: 2-3 days.
A rebound from the level of 16.66, as from resistance, followed by a breakdown of 16.55, 16.51 marks, may become a signal for corrective sales with targets at 16.30, 16.27. Stop-loss – 16.00. Implementation period: 2-3 days.
Silver prices rose significantly on Thursday, recovering after several days of mixed trades, where "bearish" sentiment prevailed. Yesterday, the instrument was supported by weak statistics from the US, as well as increased demand for safe haven assets amid tension between the US and Iran.
The main pressure on Thursday was negative data on inflation in the US. In April, the consumer price index rose from 2.4% to 2.5% YoY but the base consumer price index, the target for interest rate changes, remained at the same level of 2.1% instead of the expected growth. This statistics, along with the latest mixed data from the US labor market, alarms investors, making them wary of slowing the pace of the Fed's key interest rate increase.
Support and resistance
Bollinger Bands in D1 chart demonstrate flat dynamics. The price range has also consolidated after the decline, outlining the approximate boundary of the short-term/medium-term flat corridor.
MACD indicator is growing preserving a buy signal (locating above the signal line) and is trying to gain a foothold above the zero mark.
Stochastic retains upward direction, but is located near its maximum levels, which indicates overbought silver in the ultra-short term.
Technical indicators remain contradictory; therefore, to open new positions, it is necessary to wait for clarification of the situation.
Resistance levels: 16.66, 16.78, 16.82, 16.92, 17.00.
Support levels: 16.51, 16.44, 16.27, 16.20.
Trading tips
To open long positions one can rely on the breakout of the resistance level of 16.66, while maintaining "bullish" signals from technical indicators. Take-profit — 16.82 or 16.92, 17.00. Stop-loss – 16.50. Implementation period: 2-3 days.
A rebound from the level of 16.66, as from resistance, followed by a breakdown of 16.55, 16.51 marks, may become a signal for corrective sales with targets at 16.30, 16.27. Stop-loss – 16.00. Implementation period: 2-3 days.


No comments:
Write comments