
XAG/USD: silver prices are going down
29 May 2018, 10:20
| Scenario | |
|---|---|
| Timeframe | Intraday |
| Recommendation | BUY STOP |
| Entry Point | 16.47 |
| Take Profit | 16.56, 16.60, 16.62 |
| Stop Loss | 16.35 |
| Key Levels | 16.00, 16.09, 16.20, 16.33, 16.44, 16.51, 16.62, 16.74 |
| Alternative scenario | |
|---|---|
| Recommendation | SELL STOP |
| Entry Point | 16.30 |
| Take Profit | 16.20, 16.15 |
| Stop Loss | 16.43 |
| Key Levels | 16.00, 16.09, 16.20, 16.33, 16.44, 16.51, 16.62, 16.74 |
Current trend
Prices for silver slightly decreased on Monday, continuing the development of the "bearish" trend of last Friday, when the instrument retreated from its two-week highs. Trading activity remained low yesterday, as markets in the US were closed on the occasion of Memorial Day.
Investors are waiting for US and EU trade negotiations and US employment market data, which determines Fed’s interest rate greatly. The unemployment rate is expected to stay around 3.9%, as employment statistics will grow from 164K to 185K, which reflects positive trends in the US economy. EU-US trade negotiations are complicated. On June 1, 25% tax on steel and aluminum, supplied to the US from EU, will be implied.
Support and resistance
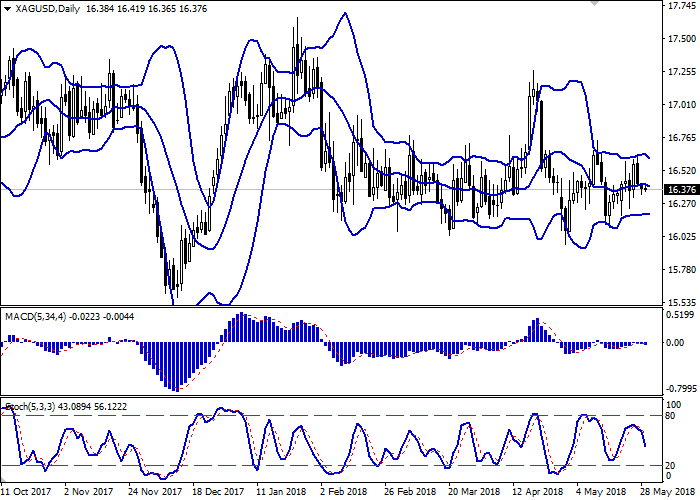
Bollinger Bands in D1 chart demonstrate flat dynamics. The price range is narrowing from above, reflecting low trading activity of recent days.
MACD indicator is extending horizontally near the zero mark, characterizing flat trades in the short and ultra-short term. At the same time, the indicator still keeps a weak sell signal.
Stochastic is showing slightly more stable dynamics and is going down quickly locating in the middle of its area.
Technical indicators do not contradict the further development of the "bearish" trend in the short or ultra-short term.
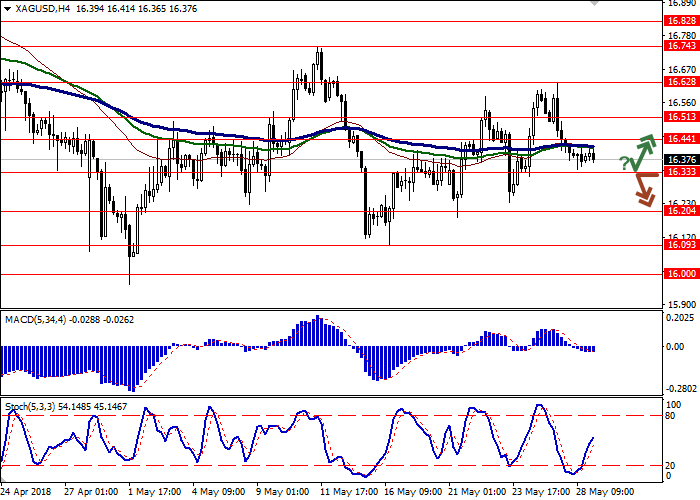
Resistance levels: 16.44, 16.51, 16.62, 16.74.
Support levels: 16.33, 16.20, 16.09, 16.00.
Trading tips
Long positions may be opened if the instrument rebounds from the level of 16.33 followed by the breakout of 16.44 mark. Take-profit — 16.56 or 16.60, 16.62. Stop-loss — 16.35.
A breakdown of the level of 16.33 may be a signal to further sales with targets at 16.20 or 16.15 marks. Stop-loss — 16.43.
Implementation period: 2-3 days.
Prices for silver slightly decreased on Monday, continuing the development of the "bearish" trend of last Friday, when the instrument retreated from its two-week highs. Trading activity remained low yesterday, as markets in the US were closed on the occasion of Memorial Day.
Investors are waiting for US and EU trade negotiations and US employment market data, which determines Fed’s interest rate greatly. The unemployment rate is expected to stay around 3.9%, as employment statistics will grow from 164K to 185K, which reflects positive trends in the US economy. EU-US trade negotiations are complicated. On June 1, 25% tax on steel and aluminum, supplied to the US from EU, will be implied.
Support and resistance
Bollinger Bands in D1 chart demonstrate flat dynamics. The price range is narrowing from above, reflecting low trading activity of recent days.
MACD indicator is extending horizontally near the zero mark, characterizing flat trades in the short and ultra-short term. At the same time, the indicator still keeps a weak sell signal.
Stochastic is showing slightly more stable dynamics and is going down quickly locating in the middle of its area.
Technical indicators do not contradict the further development of the "bearish" trend in the short or ultra-short term.
Resistance levels: 16.44, 16.51, 16.62, 16.74.
Support levels: 16.33, 16.20, 16.09, 16.00.
Trading tips
Long positions may be opened if the instrument rebounds from the level of 16.33 followed by the breakout of 16.44 mark. Take-profit — 16.56 or 16.60, 16.62. Stop-loss — 16.35.
A breakdown of the level of 16.33 may be a signal to further sales with targets at 16.20 or 16.15 marks. Stop-loss — 16.43.
Implementation period: 2-3 days.


No comments:
Write comments