
XAG/USD: silver prices are going down
15 May 2018, 09:58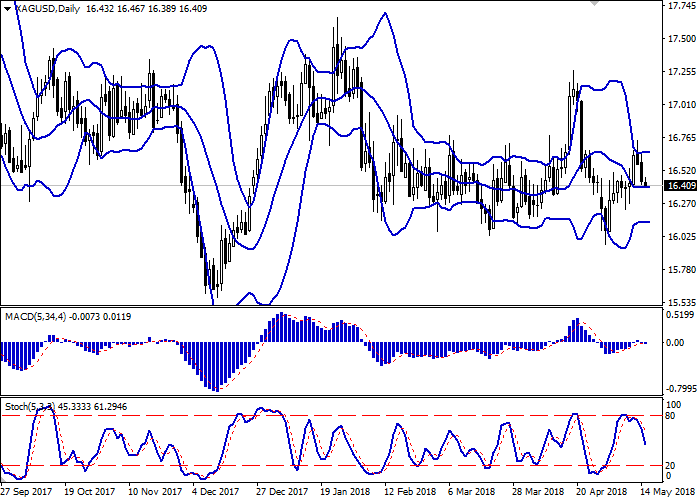
| Scenario | |
|---|---|
| Timeframe | Intraday |
| Recommendation | BUY STOP |
| Entry Point | 16.47 |
| Take Profit | 16.66, 16.74 |
| Stop Loss | 16.30 |
| Key Levels | 16.00, 16.09, 16.20, 16.33, 16.44, 16.51, 16.66, 16.74 |
| Alternative scenario | |
|---|---|
| Recommendation | SELL STOP |
| Entry Point | 16.28 |
| Take Profit | 16.09, 16.00 |
| Stop Loss | 16.45 |
| Key Levels | 16.00, 16.09, 16.20, 16.33, 16.44, 16.51, 16.66, 16.74 |
Current trend
Prices for silver fell noticeably on Monday, continuing the development of the "bearish" trend of the end of last week. In the absence of significant macroeconomic news, investors focused mainly on the previous technical factors. USD managed to maintain its upward direction against its main competitors, although it retreated from local highs against the background of unimpressive data on inflation last week.
Today, traders focus on statistics on retail sales from the US and the dynamics of GDP and industrial production in the eurozone. GDP is expected to stay on the same levels (0.4% QoQ and 2.5% YoY), and March Industrial Production can grow from –0.8% to 0.6% MoM and from 2.9% to 3.7% YoY.
Support and resistance
Bollinger Bands in D1 chart demonstrate flat dynamics. The price range consolidated in fairly wide boundaries, limiting the growth of the instrument to current local highs.
MACD is reversing downwards forming a sell signal (the histogram is located below the signal line). In addition, the indicator tests the zero mark for the breakdown.
Stochastic is going down and is located in the middle of its area.
Current indicators do not contradict the further development of the downward trend in the short or ultra-short term, so one should focus on sales.
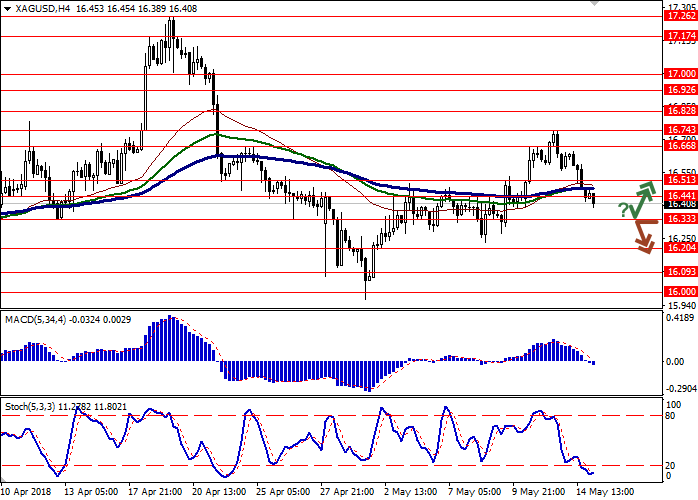
Resistance levels: 16.44, 16.51, 16.66, 16.74.
Support levels: 16.33, 16.20, 16.09, 16.00.

Trading tips
To open long positions, one can rely on the rebound from the support level of 16.33, with the subsequent breakout of the 16.44 mark. Take-profit – 16.66–16.74. Stop-loss – 16.30. Implementation period: 2-3 days.
The breakdown of 16.33 mark may serve as a signal to further sales with the targets at 16.09, 16.00. Stop-loss – 16.45. Implementation period: 2-3 days.
Prices for silver fell noticeably on Monday, continuing the development of the "bearish" trend of the end of last week. In the absence of significant macroeconomic news, investors focused mainly on the previous technical factors. USD managed to maintain its upward direction against its main competitors, although it retreated from local highs against the background of unimpressive data on inflation last week.
Today, traders focus on statistics on retail sales from the US and the dynamics of GDP and industrial production in the eurozone. GDP is expected to stay on the same levels (0.4% QoQ and 2.5% YoY), and March Industrial Production can grow from –0.8% to 0.6% MoM and from 2.9% to 3.7% YoY.
Support and resistance
Bollinger Bands in D1 chart demonstrate flat dynamics. The price range consolidated in fairly wide boundaries, limiting the growth of the instrument to current local highs.
MACD is reversing downwards forming a sell signal (the histogram is located below the signal line). In addition, the indicator tests the zero mark for the breakdown.
Stochastic is going down and is located in the middle of its area.
Current indicators do not contradict the further development of the downward trend in the short or ultra-short term, so one should focus on sales.
Resistance levels: 16.44, 16.51, 16.66, 16.74.
Support levels: 16.33, 16.20, 16.09, 16.00.
Trading tips
To open long positions, one can rely on the rebound from the support level of 16.33, with the subsequent breakout of the 16.44 mark. Take-profit – 16.66–16.74. Stop-loss – 16.30. Implementation period: 2-3 days.
The breakdown of 16.33 mark may serve as a signal to further sales with the targets at 16.09, 16.00. Stop-loss – 16.45. Implementation period: 2-3 days.


No comments:
Write comments