
USD/CHF: the pair is trading flat
15 May 2018, 10:03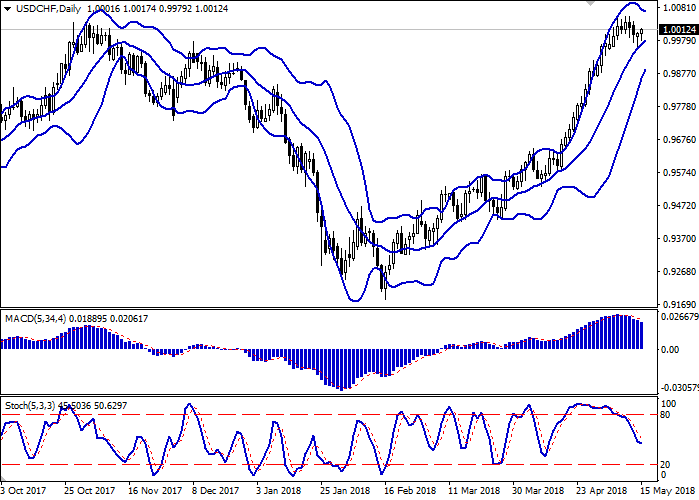
| Scenario | |
|---|---|
| Timeframe | Intraday |
| Recommendation | BUY STOP |
| Entry Point | 1.0025, 1.0060 |
| Take Profit | 1.0082, 1.0100 |
| Stop Loss | 1.0000, 0.9970 |
| Key Levels | 0.9894, 0.9940, 0.9967, 1.0000, 1.0020, 1.0054, 1.0082, 1.0100 |
| Alternative scenario | |
|---|---|
| Recommendation | SELL STOP |
| Entry Point | 0.9990 |
| Take Profit | 0.9940, 0.9900 |
| Stop Loss | 1.0050 |
| Key Levels | 0.9894, 0.9940, 0.9967, 1.0000, 1.0020, 1.0054, 1.0082, 1.0100 |
Current trend
Yesterday USD insignificantly grew against CHF despite the renewal of local lows since May 2 during the session.
As there is lack of macroeconomic releases, the movement of the currency is due to technical reasons. The dollar is under pressure of negative April US inflation data. In the pair with EUR, it is negatively affected by the commentaries of the senior members of ECB.
Today the traders will focus on April Retail Sales data, which constitute a large proportion of GDP. The statistic is expected to be mixed: the general Retail Sales April index can fall from 0.6% to 0.3%, and Retail Sales ex Autos indicator can grow from 0.2% to 0.5%.
Support and resistance
On the daily chart, Bollinger Bands are steadily growing. The price range is actively narrowing, reacting to the mixed dynamics appearance in the short term. MACD is going down; keeping a moderate sell signal (the histogram is below the signal line). Stochastic is pointed downwards but is reacting to mainly “bullish” beginning of the trading week. The indicator is now tending to reverse horizontally. It is better to wait until the indicators’ readings are clear, as they are mixed now.
Resistance levels: 1.0020, 1.0054, 1.0082, 1.0100.
Support levels: 1.0000, 0.9967, 0.9940, 0.9894.
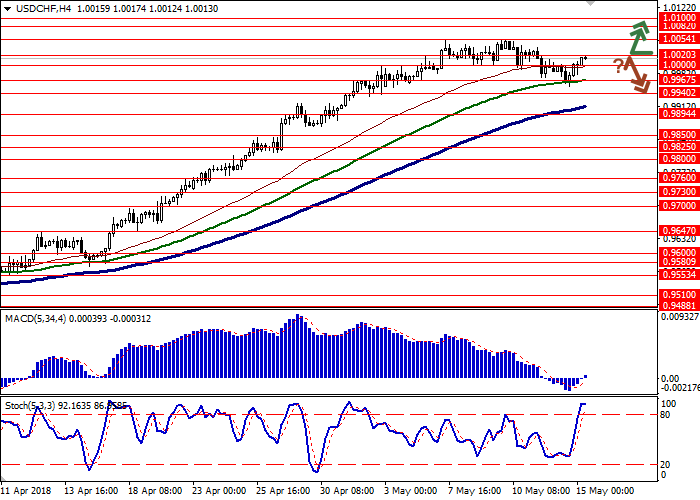

Trading tips
Long positions can be opened after the breakout of the levels of 1.0020 or 1.0054 with the targets at 1.0082–1.0100 and stop loss 1.0000 or 0.9970.
Short positions can be opened after the rebound at the level of 1.0020 and the breakdown of the level 1.0000 with the targets at 0.9940–0.9900 and stop loss 1.0050.
Implementation period: 1–2 days.
Yesterday USD insignificantly grew against CHF despite the renewal of local lows since May 2 during the session.
As there is lack of macroeconomic releases, the movement of the currency is due to technical reasons. The dollar is under pressure of negative April US inflation data. In the pair with EUR, it is negatively affected by the commentaries of the senior members of ECB.
Today the traders will focus on April Retail Sales data, which constitute a large proportion of GDP. The statistic is expected to be mixed: the general Retail Sales April index can fall from 0.6% to 0.3%, and Retail Sales ex Autos indicator can grow from 0.2% to 0.5%.
Support and resistance
On the daily chart, Bollinger Bands are steadily growing. The price range is actively narrowing, reacting to the mixed dynamics appearance in the short term. MACD is going down; keeping a moderate sell signal (the histogram is below the signal line). Stochastic is pointed downwards but is reacting to mainly “bullish” beginning of the trading week. The indicator is now tending to reverse horizontally. It is better to wait until the indicators’ readings are clear, as they are mixed now.
Resistance levels: 1.0020, 1.0054, 1.0082, 1.0100.
Support levels: 1.0000, 0.9967, 0.9940, 0.9894.
Trading tips
Long positions can be opened after the breakout of the levels of 1.0020 or 1.0054 with the targets at 1.0082–1.0100 and stop loss 1.0000 or 0.9970.
Short positions can be opened after the rebound at the level of 1.0020 and the breakdown of the level 1.0000 with the targets at 0.9940–0.9900 and stop loss 1.0050.
Implementation period: 1–2 days.


No comments:
Write comments