
WTI Crude Oil: the price is consolidating
16 May 2018, 10:38| Scenario | |
|---|---|
| Timeframe | Intraday |
| Recommendation | BUY STOP |
| Entry Point | 71.85 |
| Take Profit | 72.50, 72.80 |
| Stop Loss | 71.20 |
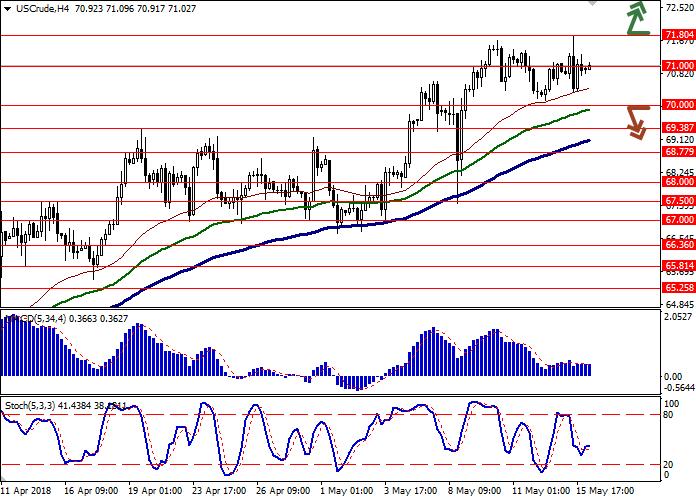
| Key Levels | 68.00, 68.77, 69.38, 70.00, 71.00, 71.80 |
| Alternative scenario | |
|---|---|
| Recommendation | SELL STOP |
| Entry Point | 69.90 |
| Take Profit | 69.00, 68.77, 68.50 |
| Stop Loss | 70.50, 70.60 |
| Key Levels | 68.00, 68.77, 69.38, 70.00, 71.00, 71.80 |
Current trend
Yesterday oil prices grew and renewed the record maximum, touching level of 71.80, supported by the high possibility of US sanctions against Iran implementation, which can lead to the fall of the export in the whole Middle East sector.
The further strengthening of the instrument is prevented by quite strong USD positions, which are supported by the growth of US treasury bonds’ yield, and investors’ concern upon the possibility of Chinese economy slowing.
The prices are under pressure of API Weekly Crude Oil Stock release, which reflected the rapid growth by 4.854 million barrel after the fall by 1.850 million barrel in the previous week.
Support and resistance
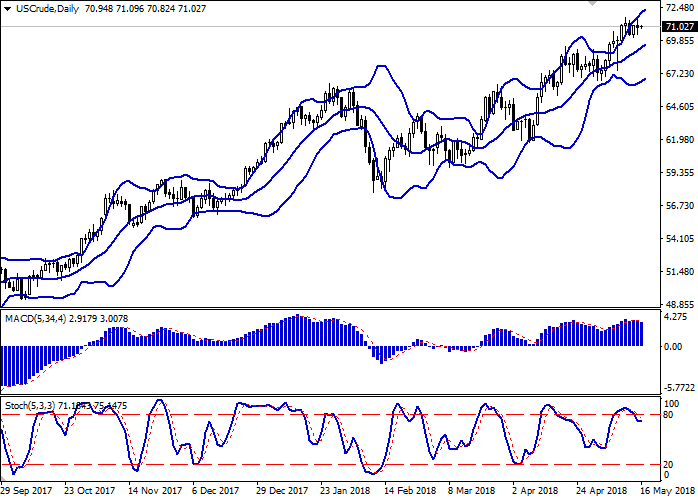
On the daily chart, Bollinger Bands are strongly growing. The price range stays the same but lets the “bulls” reach new highs. MACD is gradually reversing upwards but keeps the sell signal (the histogram is below the signal line). After short decrease, Stochastic has reversed horizontally, staying near its highs.
The technical indicators’ readings are mixed, so it is better to wait until the situation is clear.
Resistance levels: 71.00, 71.80.
Support levels: 70.00, 69.38, 68.77, 68.00.
Trading tips
Long positions can be opened after the breakout of the level 71.80 with the targets at 72.50–72.80 and stop loss 71.20. Implementation period: 2–3 days.
Short positions can be opened after the breakdown of the level 70.00 with the targets at 69.00 or 68.77–68.50 and stop loss 70.50–70.60. Implementation period: 2–3 days.
Yesterday oil prices grew and renewed the record maximum, touching level of 71.80, supported by the high possibility of US sanctions against Iran implementation, which can lead to the fall of the export in the whole Middle East sector.
The further strengthening of the instrument is prevented by quite strong USD positions, which are supported by the growth of US treasury bonds’ yield, and investors’ concern upon the possibility of Chinese economy slowing.
The prices are under pressure of API Weekly Crude Oil Stock release, which reflected the rapid growth by 4.854 million barrel after the fall by 1.850 million barrel in the previous week.
Support and resistance
On the daily chart, Bollinger Bands are strongly growing. The price range stays the same but lets the “bulls” reach new highs. MACD is gradually reversing upwards but keeps the sell signal (the histogram is below the signal line). After short decrease, Stochastic has reversed horizontally, staying near its highs.
The technical indicators’ readings are mixed, so it is better to wait until the situation is clear.
Resistance levels: 71.00, 71.80.
Support levels: 70.00, 69.38, 68.77, 68.00.
Trading tips
Long positions can be opened after the breakout of the level 71.80 with the targets at 72.50–72.80 and stop loss 71.20. Implementation period: 2–3 days.
Short positions can be opened after the breakdown of the level 70.00 with the targets at 69.00 or 68.77–68.50 and stop loss 70.50–70.60. Implementation period: 2–3 days.


No comments:
Write comments