
WTI Crude Oil: general analysis
10 May 2018, 15:37
| Scenario | |
|---|---|
| Timeframe | Intraday |
| Recommendation | BUY STOP |
| Entry Point | 71.90 |
| Take Profit | 72.65, 73.43 |
| Stop Loss | 71.50 |
| Key Levels | 69.53, 70.30, 71.09, 71.87, 72.65, 73.43 |
| Alternative scenario | |
|---|---|
| Recommendation | SELL STOP |
| Entry Point | 71.00 |
| Take Profit | 70.30, 68.75 |
| Stop Loss | 71.50 |
| Key Levels | 69.53, 70.30, 71.09, 71.87, 72.65, 73.43 |
Current trend
During the week, oil prices were growing and now are trading around 71.50 after EIA Crude Oil Stocks change release on Wednesday, which decreased more than expected, by 2.197 million barrel. Gas resources decreased by 2.055 million barrel and distillates – by 6.674 million barrel.
The investors are focused on Iran. After America left Iranian nuclear agreement, the traders expect Trump administration to imply sanctions, which can significantly restrict Iranian oil export. Now it is the third OPEC country, which shares 4% of the world oil market and exports 3.8 million barrel per day. US sanctions can make a shortage in the market, which can be used by competitors. Saudi Arabia can increase the production: its representatives have stated they would cooperate with “black gold” consumers to minimize the effect form Iranian oil supply decrease. Iranian quota within OPEC+ Agreement can be redistributed. The Organization plans to discuss it at the end of the month. US shale oil producers can increase its part, too.
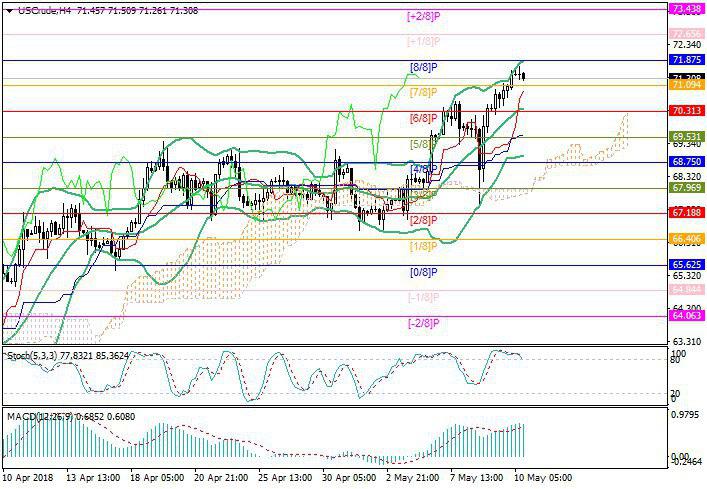
Support and resistance
The key “bullish” level if 71.87 (Murray [8/8]), the breakout of which will let the price grow to the levels of 72.65 (Murray [+1/8]) and 73.43 (Murray [+2/8]). However, the reversal of Stochastic in the overbought area allows the development of the correction to the levels of 70.31 (Murray [6/8], the middle line of Bollinger Bands) and 69.53 (Murray [5/8]).
Resistance levels: 71.87, 72.65, 73.43.
Support levels: 71.09, 70.30, 69.53.
Trading tips
Long positions can be opened above the level of 71.87 with the targets at 72.65, 73.43 and stop loss near the level of 71.50.
Short positions can be opened below the level of 71.09 with the targets at 70.30, 68.75 and stop loss 71.50.
Implementation period: 5–7 days.
During the week, oil prices were growing and now are trading around 71.50 after EIA Crude Oil Stocks change release on Wednesday, which decreased more than expected, by 2.197 million barrel. Gas resources decreased by 2.055 million barrel and distillates – by 6.674 million barrel.
The investors are focused on Iran. After America left Iranian nuclear agreement, the traders expect Trump administration to imply sanctions, which can significantly restrict Iranian oil export. Now it is the third OPEC country, which shares 4% of the world oil market and exports 3.8 million barrel per day. US sanctions can make a shortage in the market, which can be used by competitors. Saudi Arabia can increase the production: its representatives have stated they would cooperate with “black gold” consumers to minimize the effect form Iranian oil supply decrease. Iranian quota within OPEC+ Agreement can be redistributed. The Organization plans to discuss it at the end of the month. US shale oil producers can increase its part, too.
Support and resistance
The key “bullish” level if 71.87 (Murray [8/8]), the breakout of which will let the price grow to the levels of 72.65 (Murray [+1/8]) and 73.43 (Murray [+2/8]). However, the reversal of Stochastic in the overbought area allows the development of the correction to the levels of 70.31 (Murray [6/8], the middle line of Bollinger Bands) and 69.53 (Murray [5/8]).
Resistance levels: 71.87, 72.65, 73.43.
Support levels: 71.09, 70.30, 69.53.
Trading tips
Long positions can be opened above the level of 71.87 with the targets at 72.65, 73.43 and stop loss near the level of 71.50.
Short positions can be opened below the level of 71.09 with the targets at 70.30, 68.75 and stop loss 71.50.
Implementation period: 5–7 days.


No comments:
Write comments