
Visa Inc. (V/NYSE): general analysis
09 May 2018, 11:36
| Scenario | |
|---|---|
| Timeframe | Intraday |
| Recommendation | BUY STOP |
| Entry Point | 130.10 |
| Take Profit | 133.00, 135.00, 138.00 |
| Stop Loss | 127.00 |
| Key Levels | 117.00, 121.50, 126.00, 130.00 |
Current trend
After the release of the strong quarterly report on April 25, Visa stocks grew by 7%. The statistic has exceeded The Wall Street income and profit expectations. The instrument is renewing its historical highs since the end of the last week. The income grew by 13% YoY to 5.07 billion USD, the corrected EPS increased by 30% YoY to 1.11 USD. Visa has also exceeded the YoY forecast of the corrected profit, expecting the average growth by 20% against the previous year.
During the last week, Visa grew by 1.87% against the growth of S&P 500 index by 0.44%.
Support and resistance
The global upward trend is developing. During the yesterday trading session, the instrument has renewed its historical maximum. The price is now testing the local resistance level of 130.00. The level of 126.00 is the “mirror” support. The instrument can grow further. The indicators reflect the strength of buyers: the price consolidated above МА (50) and МА (200); MACD is in the positive zone and growing. It is better to open the positions according to the current trend.
The comparative analysis of the indicators of the company and its competitors suggests that its shares are underpriced.
Resistance levels: 130.00.
Support levels: 126.00, 121.50, 117.00.
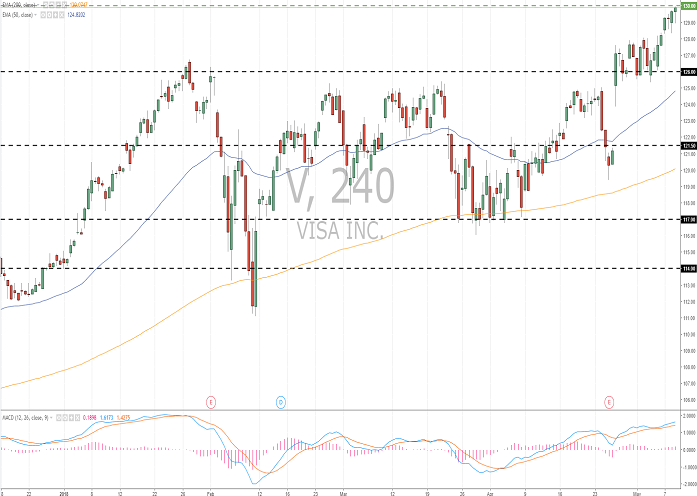
Trading tips
Long positions can be opened after the price is set above the level of 130.00. The closing of the profitable positions is possible at the levels of 133.00, 135.00 and 138.00. Stop loss is 127.00.
It is better to use trailing stop while trading.
Implementation period: 3 days.
After the release of the strong quarterly report on April 25, Visa stocks grew by 7%. The statistic has exceeded The Wall Street income and profit expectations. The instrument is renewing its historical highs since the end of the last week. The income grew by 13% YoY to 5.07 billion USD, the corrected EPS increased by 30% YoY to 1.11 USD. Visa has also exceeded the YoY forecast of the corrected profit, expecting the average growth by 20% against the previous year.
During the last week, Visa grew by 1.87% against the growth of S&P 500 index by 0.44%.
Support and resistance
The global upward trend is developing. During the yesterday trading session, the instrument has renewed its historical maximum. The price is now testing the local resistance level of 130.00. The level of 126.00 is the “mirror” support. The instrument can grow further. The indicators reflect the strength of buyers: the price consolidated above МА (50) and МА (200); MACD is in the positive zone and growing. It is better to open the positions according to the current trend.
The comparative analysis of the indicators of the company and its competitors suggests that its shares are underpriced.
Resistance levels: 130.00.
Support levels: 126.00, 121.50, 117.00.
Trading tips
Long positions can be opened after the price is set above the level of 130.00. The closing of the profitable positions is possible at the levels of 133.00, 135.00 and 138.00. Stop loss is 127.00.
It is better to use trailing stop while trading.
Implementation period: 3 days.


No comments:
Write comments