
USD/JPY: dollar is dropping
25 May 2018, 10:12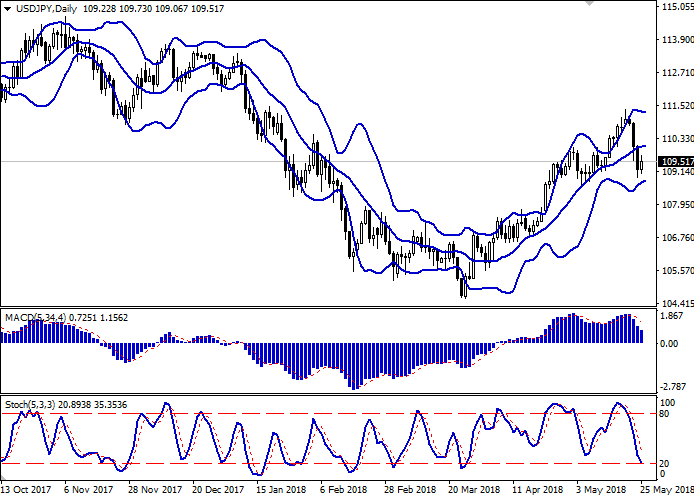
| Scenario | |
|---|---|
| Timeframe | Intraday |
| Recommendation | BUY STOP |
| Entry Point | 109.80, 110.10 |
| Take Profit | 110.50, 110.70, 111.00 |
| Stop Loss | 109.50, 109.30 |
| Key Levels | 108.26, 108.52, 108.92, 109.25, 109.76, 110.00, 110.43, 110.70 |
| Alternative scenario | |
|---|---|
| Recommendation | SELL STOP |
| Entry Point | 109.20, 108.90 |
| Take Profit | 108.50, 108.25 |
| Stop Loss | 109.50, 109.75 |
| Key Levels | 108.26, 108.52, 108.92, 109.25, 109.76, 110.00, 110.43, 110.70 |
Current trend
USD showed a stable decrease against JPY on Thursday, updating the local low of May 8. The reason for the development of the "bearish" trend was investors' assessment of the Fed's protocol published earlier, as well as Thursday's mixed macroeconomic statistics from the US.
Data from Japan also proved to be mixed and did not have a significant impact on the dynamics of trading. The index of leading indicators was worse than the forecast and amounted to 104.4 points in March against 105.9 points a month earlier. The index of coinciding indicators confirmed forecasts and rose to 116.6 points in March from 116.0 points a month earlier.
Today, USD shows strong growth against JPY due to the publication of weak data from Japan. Tokyo CPI excluding fresh food went down from +0.6% YoY to +0.5% YoY in May, which is worse than market expectations (+0.6% YoY).
Support and resistance
On the D1 chart Bollinger Bands are reversing horizontally. The price range is narrowing, reflecting the emergence of mixed trading dynamics.
MACD is going down preserving a stable sell signal (being located significantly below the signal line).
Stochastic shows similar dynamics but is approaching its minimum marks, which indicates the oversold dollar in the short term.
Existing short positions should be left open for some time.
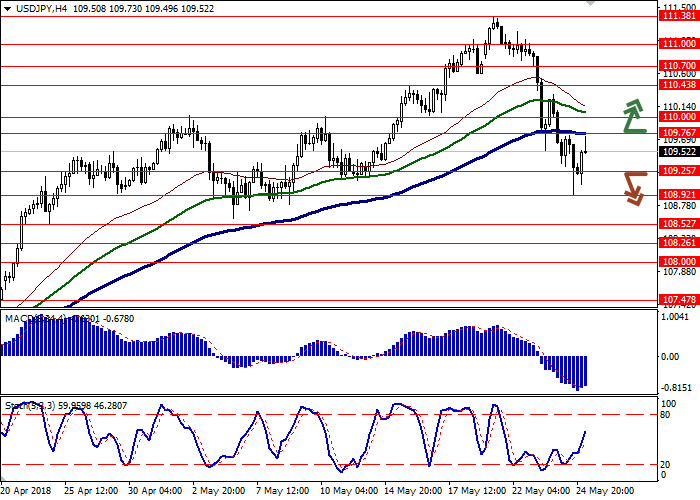
Resistance levels: 109.76, 110.00, 110.43, 110.70.
Support levels: 109.25, 108.92, 108.52, 108.26.

Trading tips
To open long positions, one can rely on the breakout of 109.76 or 110.00 marks. Take-profit — 110.50–110.70 or 111.00. Stop-loss — 109.50, 109.30.
The return of "bearish" trend with the breakdown of the level of 109.25 or 109.00 may become a signal for new sales with the target at 108.50–108.25. Stop-loss — 109.50, 109.75.
Implementation period: 2-3 days.
USD showed a stable decrease against JPY on Thursday, updating the local low of May 8. The reason for the development of the "bearish" trend was investors' assessment of the Fed's protocol published earlier, as well as Thursday's mixed macroeconomic statistics from the US.
Data from Japan also proved to be mixed and did not have a significant impact on the dynamics of trading. The index of leading indicators was worse than the forecast and amounted to 104.4 points in March against 105.9 points a month earlier. The index of coinciding indicators confirmed forecasts and rose to 116.6 points in March from 116.0 points a month earlier.
Today, USD shows strong growth against JPY due to the publication of weak data from Japan. Tokyo CPI excluding fresh food went down from +0.6% YoY to +0.5% YoY in May, which is worse than market expectations (+0.6% YoY).
Support and resistance
On the D1 chart Bollinger Bands are reversing horizontally. The price range is narrowing, reflecting the emergence of mixed trading dynamics.
MACD is going down preserving a stable sell signal (being located significantly below the signal line).
Stochastic shows similar dynamics but is approaching its minimum marks, which indicates the oversold dollar in the short term.
Existing short positions should be left open for some time.
Resistance levels: 109.76, 110.00, 110.43, 110.70.
Support levels: 109.25, 108.92, 108.52, 108.26.
Trading tips
To open long positions, one can rely on the breakout of 109.76 or 110.00 marks. Take-profit — 110.50–110.70 or 111.00. Stop-loss — 109.50, 109.30.
The return of "bearish" trend with the breakdown of the level of 109.25 or 109.00 may become a signal for new sales with the target at 108.50–108.25. Stop-loss — 109.50, 109.75.
Implementation period: 2-3 days.


No comments:
Write comments