
USD/CHF: USD is strengthening
07 May 2018, 09:55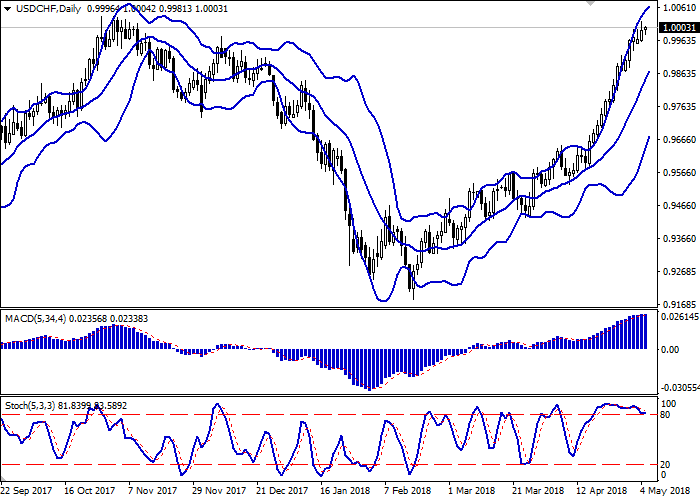
| Scenario | |
|---|---|
| Timeframe | Intraday |
| Recommendation | BUY STOP |
| Entry Point | 1.0010, 1.0030 |
| Take Profit | 1.0050, 1.0070 |
| Stop Loss | 0.9970 |
| Key Levels | 0.9850, 0.9894, 0.9940, 0.9967, 1.0000, 1.0020, 1.0050 |
| Alternative scenario | |
|---|---|
| Recommendation | SELL STOP |
| Entry Point | 0.9960 |
| Take Profit | 0.9900, 0.9880 |
| Stop Loss | 1.0000, 1.0020 |
| Key Levels | 0.9850, 0.9894, 0.9940, 0.9967, 1.0000, 1.0020, 1.0050 |
Current trend
USD showed steady growth against CHF on Friday, reaching a psychological mark of 1.0000 and updating the record high since November 2017. Then USD corrected due to technical factors and ambiguous statistics on the US labor market.
In April, the indicator of the number of non-farm jobs, although growing compared with March, but did not reach the forecasts, amounting to 164K. The average hourly wage remained at the same level of 2.6% instead of growth. But the unemployment rate fell from 4.1% to 3.9%.
The two-day trade talks between the representatives of the United States and China in Beijing didn't lead to an agreement. The parties agreed to continue the dialogue, while a number of issues were of consensus, but significant differences also remained.
Support and resistance
Bollinger Bands in D1 chart show stable growth. The price range is narrowing from below, reflecting "bullish" sentiment in the short and medium term.
MACD indicator turns into the horizontal plane, retaining the previous buy signal (being located above the signal line).
Stochastic is located near its maximum levels, indicating overbought instrument and a corrective decline appearance.
Technical indicators do not give clear signals to the opening of new trading positions. It is necessary to wait for potential formation of signals to correctional sales.
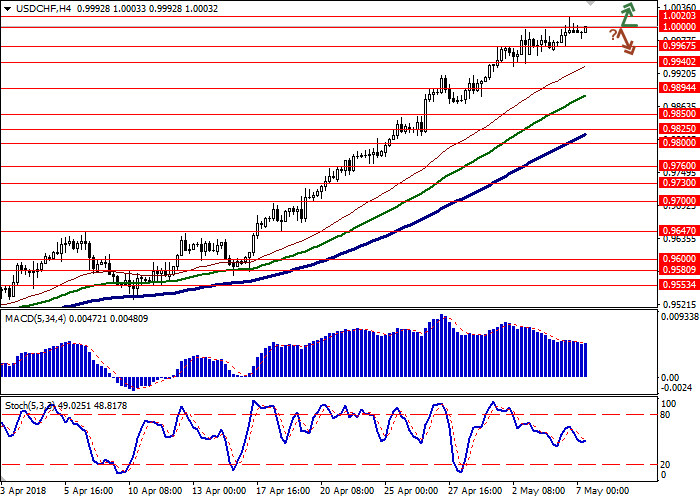
Resistance levels: 1.0000, 1.0020, 1.0050.
Support levels: 0.9967, 0.9940, 0.9894, 0.9850.

Trading tips
To open long positions, one can rely on the breakout of the current resistance levels of 1.0000 or 1.0020. Take-profit – 1.0050 or 1.0070. Stop-loss – 0.9970. Implementation period: 1-2 days.
A rebound from the level of 1.0000, as from resistance, followed by a breakdown of 0.9967 mark, may become a signal for corrective sales. In this case, the target of the "bears" may be located around 0.9900 or 0.9880 marks. Stop-loss — 1.0000 or 1.0020. Implementation period: 2-3 days.
USD showed steady growth against CHF on Friday, reaching a psychological mark of 1.0000 and updating the record high since November 2017. Then USD corrected due to technical factors and ambiguous statistics on the US labor market.
In April, the indicator of the number of non-farm jobs, although growing compared with March, but did not reach the forecasts, amounting to 164K. The average hourly wage remained at the same level of 2.6% instead of growth. But the unemployment rate fell from 4.1% to 3.9%.
The two-day trade talks between the representatives of the United States and China in Beijing didn't lead to an agreement. The parties agreed to continue the dialogue, while a number of issues were of consensus, but significant differences also remained.
Support and resistance
Bollinger Bands in D1 chart show stable growth. The price range is narrowing from below, reflecting "bullish" sentiment in the short and medium term.
MACD indicator turns into the horizontal plane, retaining the previous buy signal (being located above the signal line).
Stochastic is located near its maximum levels, indicating overbought instrument and a corrective decline appearance.
Technical indicators do not give clear signals to the opening of new trading positions. It is necessary to wait for potential formation of signals to correctional sales.
Resistance levels: 1.0000, 1.0020, 1.0050.
Support levels: 0.9967, 0.9940, 0.9894, 0.9850.
Trading tips
To open long positions, one can rely on the breakout of the current resistance levels of 1.0000 or 1.0020. Take-profit – 1.0050 or 1.0070. Stop-loss – 0.9970. Implementation period: 1-2 days.
A rebound from the level of 1.0000, as from resistance, followed by a breakdown of 0.9967 mark, may become a signal for corrective sales. In this case, the target of the "bears" may be located around 0.9900 or 0.9880 marks. Stop-loss — 1.0000 or 1.0020. Implementation period: 2-3 days.


No comments:
Write comments