USD/CAD: the pair shows mixed trend
22 May 2018, 10:21
| Scenario | |
|---|---|
| Timeframe | Intraday |
| Recommendation | BUY STOP |
| Entry Point | 1.2810 |
| Take Profit | 1.2860, 1.2900 |
| Stop Loss | 1.2750, 1.2744 |
| Key Levels | 1.2540, 1.2622, 1.2700, 1.2744, 1.2800, 1.2860, 1.2900, 1.2947 |
| Alternative scenario | |
|---|---|
| Recommendation | SELL STOP |
| Entry Point | 1.2740 |
| Take Profit | 1.2650, 1.2622, 1.2600 |
| Stop Loss | 1.2780, 1.2800 |
| Key Levels | 1.2540, 1.2622, 1.2700, 1.2744, 1.2800, 1.2860, 1.2900, 1.2947 |
Current trend
USD decreased against CAD on Monday, neutralizing growth of last week. In the absence of macroeconomic news yesterday, traders focused on the development of the US-China trade relations crisis.
Investors have met positively the results of the US-China trade negotiations in Washington, while no one expected a significant result. US Treasury Secretary Stephen Mnuchin said that the trade war between China and America is suspended, and a broad trade agreement is under construction. The parties decided to abandon the increase in taxes on each other's goods; also Beijing will substantially increase the purchases of American goods in the agricultural and energy sectors. The trade deficit can be reduced by goods amounting to $200 billion, as America wanted, although all the details will be determined later. The parties agreed to cooperate closely in the intellectual property field.
Support and resistance
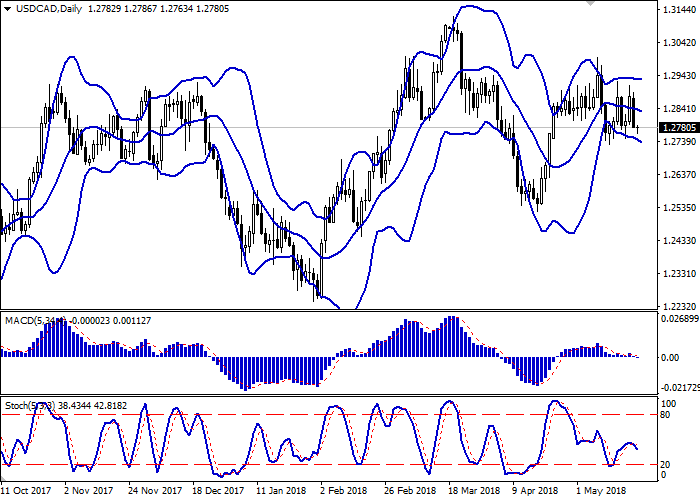
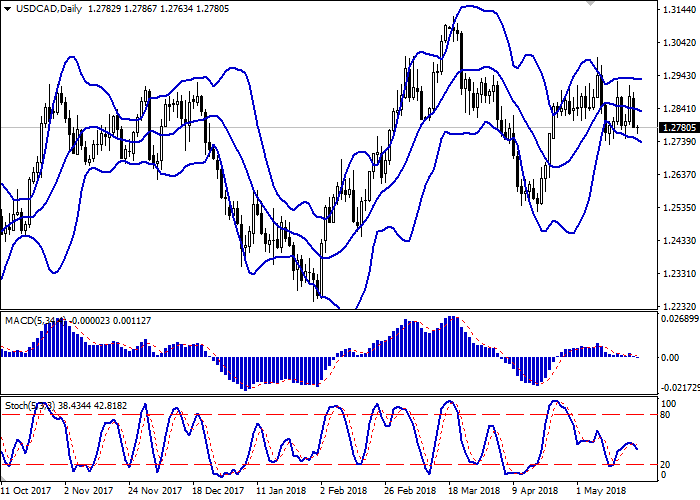
Bollinger Bands in D1 chart decrease moderately. The price range expands from below, making way to new local lows for the "bears". MACD is declining keeping a sell signal (being located below the signal line). The indicator is trying to consolidate below the zero mark. Stochastic reverses downwards after brief growth.
Technical indicators do not contradict the development of the "bearish" trend in the short and/or ultra-short term.
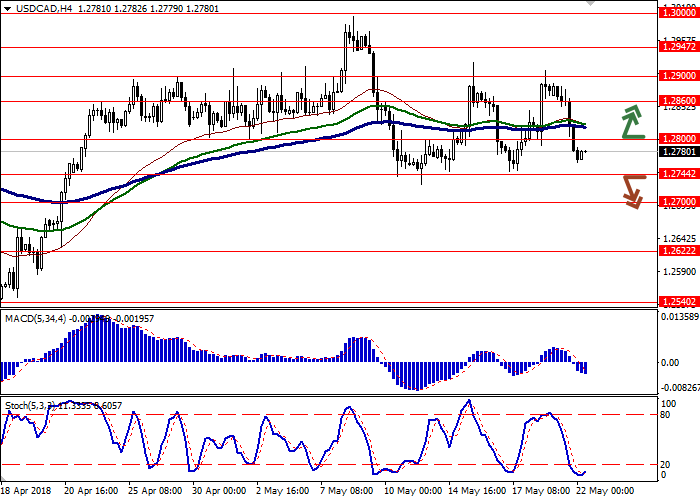
Resistance levels: 1.2800, 1.2860, 1.2900, 1.2947.
Support levels: 1.2744, 1.2700, 1.2622, 1.2540.


Trading tips
To open long positions one can rely on the breakout of the level of 1.2800, if "bullish" signals appear in the short term. Take-profit — 1.2860 or 1.2900. Stop-loss — 1.2750–1.2744. Implementation period: 2-3 days.
A confident breakdown of 1.2744 mark will strengthen the current "bearish" signals from technical indicators. The levels of 1.2650 or 1.2622, 1.2600 can become the new sales targets. Stop-loss — 1.2780 or 1.2800. Implementation period: 2-3 days.
USD decreased against CAD on Monday, neutralizing growth of last week. In the absence of macroeconomic news yesterday, traders focused on the development of the US-China trade relations crisis.
Investors have met positively the results of the US-China trade negotiations in Washington, while no one expected a significant result. US Treasury Secretary Stephen Mnuchin said that the trade war between China and America is suspended, and a broad trade agreement is under construction. The parties decided to abandon the increase in taxes on each other's goods; also Beijing will substantially increase the purchases of American goods in the agricultural and energy sectors. The trade deficit can be reduced by goods amounting to $200 billion, as America wanted, although all the details will be determined later. The parties agreed to cooperate closely in the intellectual property field.
Support and resistance
Bollinger Bands in D1 chart decrease moderately. The price range expands from below, making way to new local lows for the "bears". MACD is declining keeping a sell signal (being located below the signal line). The indicator is trying to consolidate below the zero mark. Stochastic reverses downwards after brief growth.
Technical indicators do not contradict the development of the "bearish" trend in the short and/or ultra-short term.
Resistance levels: 1.2800, 1.2860, 1.2900, 1.2947.
Support levels: 1.2744, 1.2700, 1.2622, 1.2540.


Trading tips
To open long positions one can rely on the breakout of the level of 1.2800, if "bullish" signals appear in the short term. Take-profit — 1.2860 or 1.2900. Stop-loss — 1.2750–1.2744. Implementation period: 2-3 days.
A confident breakdown of 1.2744 mark will strengthen the current "bearish" signals from technical indicators. The levels of 1.2650 or 1.2622, 1.2600 can become the new sales targets. Stop-loss — 1.2780 or 1.2800. Implementation period: 2-3 days.


No comments:
Write comments