
USD/CAD: the instrument is strengthening
09 May 2018, 10:37
| Scenario | |
|---|---|
| Timeframe | Intraday |
| Recommendation | BUY STOP |
| Entry Point | 1.3010 |
| Take Profit | 1.3070, 1.3100 |
| Stop Loss | 1.2950 |
| Key Levels | 1.2744, 1.2800, 1.2900, 1.2947, 1.3000, 1.3045, 1.3100 |
| Alternative scenario | |
|---|---|
| Recommendation | SELL STOP |
| Entry Point | 1.2940, 1.2890 |
| Take Profit | 1.2800 |
| Stop Loss | 1.2950, 1.3000 |
| Key Levels | 1.2744, 1.2800, 1.2900, 1.2947, 1.3000, 1.3045, 1.3100 |
Current trend
USD showed growth against CAD at trading on Tuesday, marking a new local maximum since March 21. However, the instrument failed to keep its positions, and by the moment of closing of the daily session, the Canadian currency was able to recoup a little.
The market was focused on US politics’ commentaries. Fed’s head Jerome Powell made a speech at the conference in Switzerland. There was no new information in his commentaries, and he noted that the market had received a signal of Fed’s intention to increase rates long ago, so it should not be surprised with it. However, he mentioned, that the rates would grow if American economy would meet the regulator’s expectations.
Later, investors switched to the statements of Donald Trump, who announced the withdrawal from the Iranian nuclear deal, which was not a surprise but significantly affected the trading.
Support and resistance
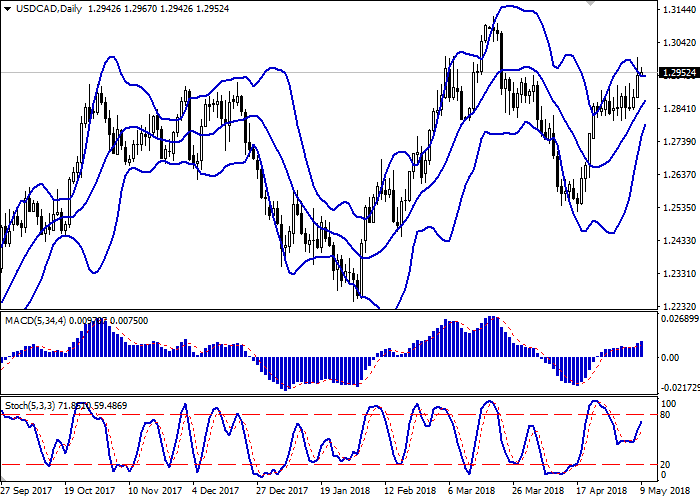
Bollinger Bands in D1 chart show stable growth. The price range is narrowing, reflecting the ambiguous dynamics of trading in the short term. MACD indicator is growing preserving a moderate buy signal (histogram is above the signal line). Stochastic also maintains an upward direction approaching the "80" mark, which is the formal border of the overbought status. The indicators do not contradict the possibility of further in the short and/or ultra-short term.
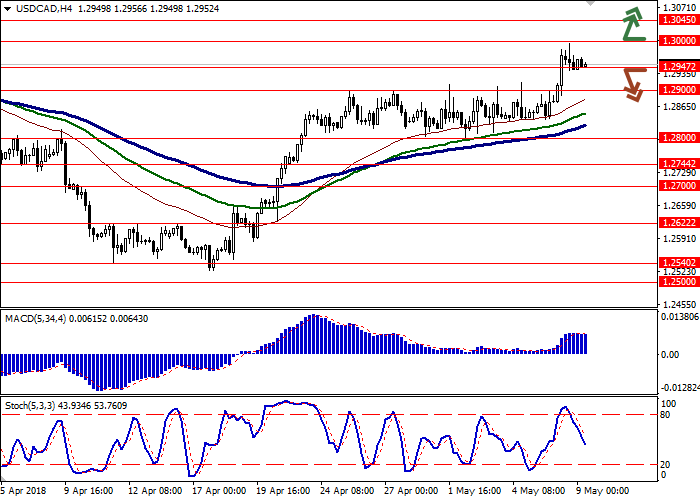
Resistance levels: 1.3000, 1.3045, 1.3100.
Support levels: 1.2947, 1.2900, 1.2800, 1.2744.
Trading tips
To open long positions, one can rely on the breakout of 1.3000 mark while maintaining the "bullish" signals from the technical indicators. Take-profit — 1.3070 or 1.3100. Stop-loss – 1.2950. Implementation time: 2 days.
The breakdown of 1.2947 or 1.2900 mark may serve as a signal to the beginning of correctional sales with the target at 1.2800. Stop-loss — 1.2950 or 1.3000. Implementation time: 2-3 days.
USD showed growth against CAD at trading on Tuesday, marking a new local maximum since March 21. However, the instrument failed to keep its positions, and by the moment of closing of the daily session, the Canadian currency was able to recoup a little.
The market was focused on US politics’ commentaries. Fed’s head Jerome Powell made a speech at the conference in Switzerland. There was no new information in his commentaries, and he noted that the market had received a signal of Fed’s intention to increase rates long ago, so it should not be surprised with it. However, he mentioned, that the rates would grow if American economy would meet the regulator’s expectations.
Later, investors switched to the statements of Donald Trump, who announced the withdrawal from the Iranian nuclear deal, which was not a surprise but significantly affected the trading.
Support and resistance
Bollinger Bands in D1 chart show stable growth. The price range is narrowing, reflecting the ambiguous dynamics of trading in the short term. MACD indicator is growing preserving a moderate buy signal (histogram is above the signal line). Stochastic also maintains an upward direction approaching the "80" mark, which is the formal border of the overbought status. The indicators do not contradict the possibility of further in the short and/or ultra-short term.
Resistance levels: 1.3000, 1.3045, 1.3100.
Support levels: 1.2947, 1.2900, 1.2800, 1.2744.
Trading tips
To open long positions, one can rely on the breakout of 1.3000 mark while maintaining the "bullish" signals from the technical indicators. Take-profit — 1.3070 or 1.3100. Stop-loss – 1.2950. Implementation time: 2 days.
The breakdown of 1.2947 or 1.2900 mark may serve as a signal to the beginning of correctional sales with the target at 1.2800. Stop-loss — 1.2950 or 1.3000. Implementation time: 2-3 days.


No comments:
Write comments