Snap Inc. (SNAP/NYSE): general analysis
22 May 2018, 11:31
| Scenario | |
|---|---|
| Timeframe | Intraday |
| Recommendation | SELL STOP |
| Entry Point | 10.45 |
| Take Profit | 9.50, 8.50, 8.00 |
| Stop Loss | 11.50 |
| Key Levels | 10.50, 11.50, 12.40, 13.60 |
| Alternative scenario | |
|---|---|
| Recommendation | BUY STOP |
| Entry Point | 11.55 |
| Take Profit | 13.00, 14.00 |
| Stop Loss | 10.50 |
| Key Levels | 10.50, 11.50, 12.40, 13.60 |
Current trend
Since the beginning of May, Snap Inc. stocks have been trading at its historic lows, falling by 37% since the moment of entering the IPO in March 2017 at $17, and decreased by more than 60% from a record high of $29.50. The shares are under pressure of the publication of the quarterly report at the beginning of this month. Key indicators have grown; however, Snap Inc. reported a slowdown in growth in the Q2 and an increase in operating costs. An additional catalyst for the fall was the active daily users’ number, which was below market expectations.
During the last week, Snap Inc. decreased by 2.46% against the growth of S&P 500 index by 0.77%.
Support and resistance
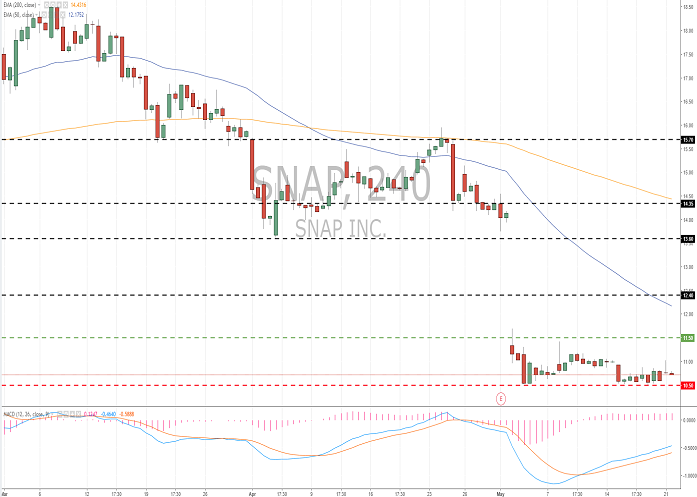
The price is consolidating after a significant decline at the beginning of this month. The instrument is testing the key support level of 10.50. The level of 11.50 is the nearest resistance. #SNAP can fall further. The indicators’ signals are mixed: the price consolidated below MA (50) and MA (200); MACD is in the positive zone. It is better to open the positions from the key levels.
The comparative analysis of the indicators of the company and its competitors suggests the neutrality of its share prices.
Resistance levels: 11.50, 12.40, 13.60.
Support levels: 10.50.

Trading tips
Short positions can be opened after the price is set below the level of 10.50. The closing of the profitable positions is possible at the levels of 9.50, 8.50 and 8.00. Stop loss is 11.50.
Long positions can be opened after the price is set above the level of 11.50 with targets of 13.00-14.00. Stop loss is 10.50.
Implementation period: 3 days.
Since the beginning of May, Snap Inc. stocks have been trading at its historic lows, falling by 37% since the moment of entering the IPO in March 2017 at $17, and decreased by more than 60% from a record high of $29.50. The shares are under pressure of the publication of the quarterly report at the beginning of this month. Key indicators have grown; however, Snap Inc. reported a slowdown in growth in the Q2 and an increase in operating costs. An additional catalyst for the fall was the active daily users’ number, which was below market expectations.
During the last week, Snap Inc. decreased by 2.46% against the growth of S&P 500 index by 0.77%.
Support and resistance
The price is consolidating after a significant decline at the beginning of this month. The instrument is testing the key support level of 10.50. The level of 11.50 is the nearest resistance. #SNAP can fall further. The indicators’ signals are mixed: the price consolidated below MA (50) and MA (200); MACD is in the positive zone. It is better to open the positions from the key levels.
The comparative analysis of the indicators of the company and its competitors suggests the neutrality of its share prices.
Resistance levels: 11.50, 12.40, 13.60.
Support levels: 10.50.

Trading tips
Short positions can be opened after the price is set below the level of 10.50. The closing of the profitable positions is possible at the levels of 9.50, 8.50 and 8.00. Stop loss is 11.50.
Long positions can be opened after the price is set above the level of 11.50 with targets of 13.00-14.00. Stop loss is 10.50.
Implementation period: 3 days.


No comments:
Write comments