
NZD/USD: New Zealand dollar is growing
28 May 2018, 09:53
| Scenario | |
|---|---|
| Timeframe | Intraday |
| Recommendation | BUY STOP |
| Entry Point | 0.6980 |
| Take Profit | 0.7051 |
| Stop Loss | 0.6935 |
| Key Levels | 0.6820, 0.6850, 0.6880, 0.6935, 0.6973, 0.7000, 0.7051, 0.7090 |
| Alternative scenario | |
|---|---|
| Recommendation | SELL STOP |
| Entry Point | 0.6930 |
| Take Profit | 0.6880, 0.6850 |
| Stop Loss | 0.6973, 0.6980 |
| Key Levels | 0.6820, 0.6850, 0.6880, 0.6935, 0.6973, 0.7000, 0.7051, 0.7090 |
Current trend
NZD today grows against USD, recovering from a moderate decline of the previous week. The growth of NZD is promoted by technical correction factors, while the markets in the US are closed on the occasion of Memorial Day.
Traders continue to focus on US-China trade relations, which have intensified recently with the threat of growing into a full-fledged trade war. However, at the end of previous week it became known that US tariffs on imports of a number of Chinese goods were temporarily frozen. This decision was made after the visit of the Chinese delegation headed by Vice Premier Liu Yandong to Washington.
Support and resistance
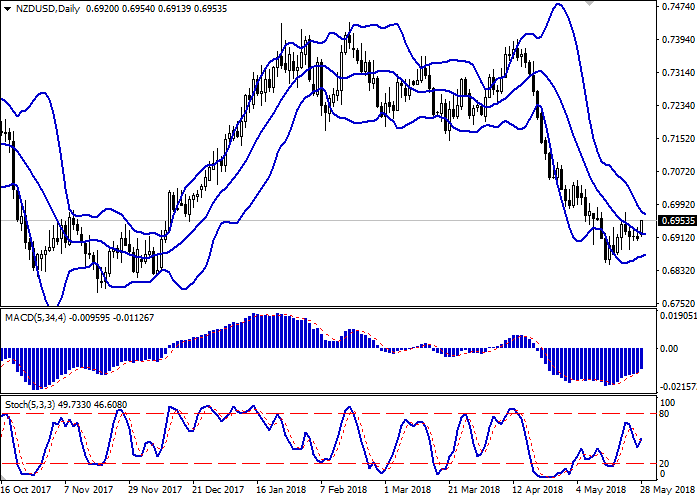
On the D1 chart Bollinger Bands are reversing horisontally. The price range is narrowing, reflecting the mixed nature of trading in the short and middle term. MACD indicator is growing keeping a moderate buy signal (the histogram is above the signal line). Stochastic also reversed upwards, reacting to the increase of the instrument. Current technical indicators show the possibility of further growth of NZD in the short and ultra-short term.
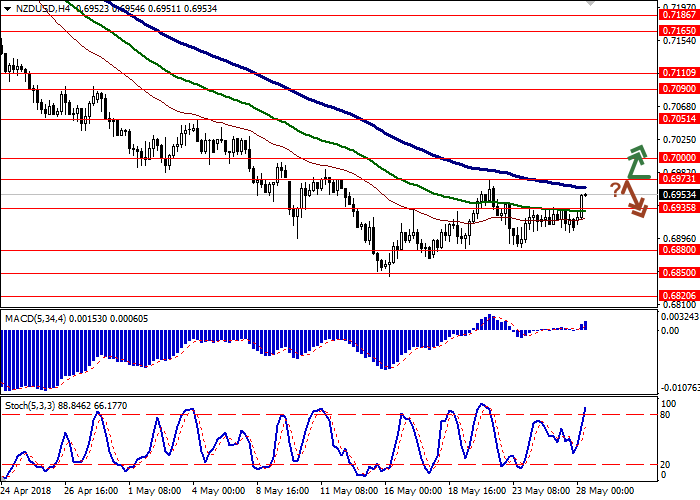
Resistance levels: 0.6973, 0.7000, 0.7051, 0.7090.
Support levels: 0.6935, 0.6880, 0.6850, 0.6820.
Trading tips
To open long positions one can rely on the breakout of the level of 0.6973, while maintaining "bullish" signals from technical indicators. Take-profit – 0.7051. Stop-loss – 0.6935.
The rebound from the level of 0.6973 as from resistance, with the subsequent breakdown of 0.6935 mark, can become a signal to the beginning of correctional sales with targets at 0.6880 or 0.6850. Stop-loss — 0.6973 or 0.6980.
Implementation period: 2-3 days.
NZD today grows against USD, recovering from a moderate decline of the previous week. The growth of NZD is promoted by technical correction factors, while the markets in the US are closed on the occasion of Memorial Day.
Traders continue to focus on US-China trade relations, which have intensified recently with the threat of growing into a full-fledged trade war. However, at the end of previous week it became known that US tariffs on imports of a number of Chinese goods were temporarily frozen. This decision was made after the visit of the Chinese delegation headed by Vice Premier Liu Yandong to Washington.
Support and resistance
On the D1 chart Bollinger Bands are reversing horisontally. The price range is narrowing, reflecting the mixed nature of trading in the short and middle term. MACD indicator is growing keeping a moderate buy signal (the histogram is above the signal line). Stochastic also reversed upwards, reacting to the increase of the instrument. Current technical indicators show the possibility of further growth of NZD in the short and ultra-short term.
Resistance levels: 0.6973, 0.7000, 0.7051, 0.7090.
Support levels: 0.6935, 0.6880, 0.6850, 0.6820.
Trading tips
To open long positions one can rely on the breakout of the level of 0.6973, while maintaining "bullish" signals from technical indicators. Take-profit – 0.7051. Stop-loss – 0.6935.
The rebound from the level of 0.6973 as from resistance, with the subsequent breakdown of 0.6935 mark, can become a signal to the beginning of correctional sales with targets at 0.6880 or 0.6850. Stop-loss — 0.6973 or 0.6980.
Implementation period: 2-3 days.


No comments:
Write comments