
NZD/USD: New Zealand dollar is going down
16 May 2018, 10:07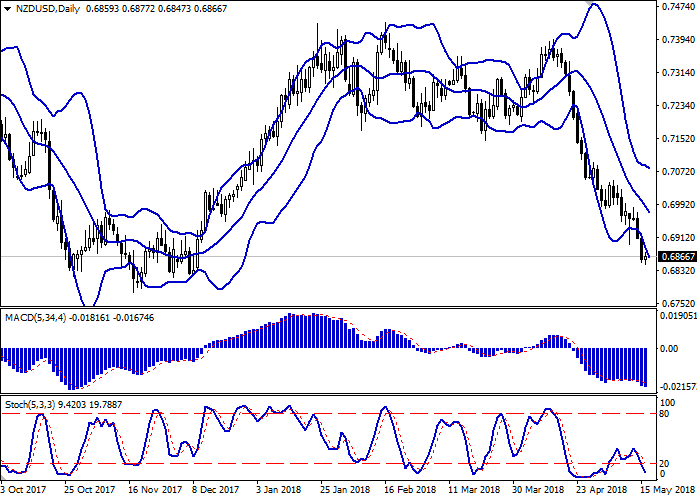
| Scenario | |
|---|---|
| Timeframe | Intraday |
| Recommendation | BUY STOP |
| Entry Point | 0.6890 |
| Take Profit | 0.6982, 0.7000 |
| Stop Loss | 0.6840, 0.6830 |
| Key Levels | 0.6779, 0.6820, 0.6850, 0.6880, 0.6913, 0.6982, 0.7000 |
| Alternative scenario | |
|---|---|
| Recommendation | SELL STOP |
| Entry Point | 0.6840 |
| Take Profit | 0.6779, 0.6750 |
| Stop Loss | 0.6900 |
| Key Levels | 0.6779, 0.6820, 0.6850, 0.6880, 0.6913, 0.6982, 0.7000 |
Current trend
Yesterday NZD decreased against the US dollar and renewed the lows since December 11, 2017, despite the mixed US Retail Sales data. In April, the MoM index increased by 0.3% (in March – by 0.8%), and YoY one grew by 0.3% (against the March growth by 0.4%).
The main strengthening momentum for USD was the growth of US treasury bonds’ yield by more than 3%. In addition, it was supported by the decrease of tightening at the Korean Peninsula and hopes of evading a full trade war between USA and China.
Today the investors are focused on US April building market data releases at 14:30 (GMT+2) and Industrial Production and Capacity Utilization publications at 15:15 (GMT+2).
Support and resistance
On the daily chart, Bollinger Bands are steadily falling. The price range is widening but not as fast as the “bearish” trend is developing. MACD is falling faster, keeping the sell signal (the histogram is below the signal line). Stochastic is pointed down, too, but is near its lows, which reflects that NZD is oversold in the short term.
It is better to open short positions in the short term until the correctional growth signal becomes clearer.
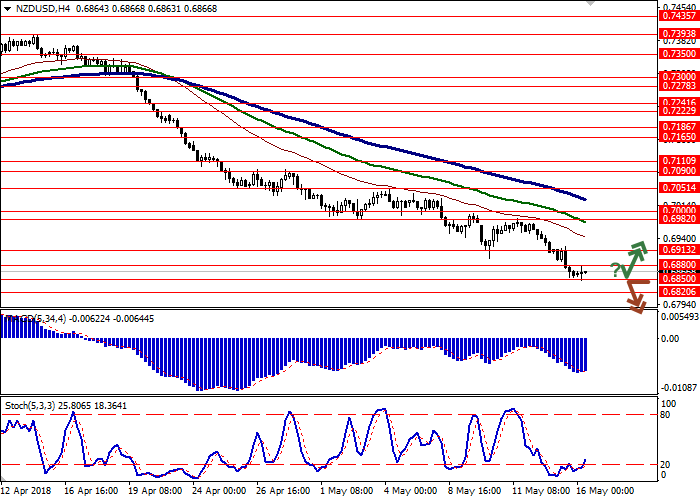
Resistance levels: 0.6880, 0.6913, 0.6982, 0.7000.
Support levels: 0.6850, 0.6820, 0.6779.

Trading tips
Long positions can be opened after the rebound at the level of 0.6850 and the breakout of the level of 0.6880 with the target at 0.6982 or 0.7000 and stop loss 0.6840–0.6830. Implementation period: 2–3 days.
Short positions can be opened after the breakdown of the level 0.6850 with the targets at 0.6779–0.6750 and stop loss 0.6900. Implementation period: 2 days.
Yesterday NZD decreased against the US dollar and renewed the lows since December 11, 2017, despite the mixed US Retail Sales data. In April, the MoM index increased by 0.3% (in March – by 0.8%), and YoY one grew by 0.3% (against the March growth by 0.4%).
The main strengthening momentum for USD was the growth of US treasury bonds’ yield by more than 3%. In addition, it was supported by the decrease of tightening at the Korean Peninsula and hopes of evading a full trade war between USA and China.
Today the investors are focused on US April building market data releases at 14:30 (GMT+2) and Industrial Production and Capacity Utilization publications at 15:15 (GMT+2).
Support and resistance
On the daily chart, Bollinger Bands are steadily falling. The price range is widening but not as fast as the “bearish” trend is developing. MACD is falling faster, keeping the sell signal (the histogram is below the signal line). Stochastic is pointed down, too, but is near its lows, which reflects that NZD is oversold in the short term.
It is better to open short positions in the short term until the correctional growth signal becomes clearer.
Resistance levels: 0.6880, 0.6913, 0.6982, 0.7000.
Support levels: 0.6850, 0.6820, 0.6779.
Trading tips
Long positions can be opened after the rebound at the level of 0.6850 and the breakout of the level of 0.6880 with the target at 0.6982 or 0.7000 and stop loss 0.6840–0.6830. Implementation period: 2–3 days.
Short positions can be opened after the breakdown of the level 0.6850 with the targets at 0.6779–0.6750 and stop loss 0.6900. Implementation period: 2 days.


No comments:
Write comments