
NZD/USD: general review
11 May 2018, 09:51
| Scenario | |
|---|---|
| Timeframe | Intraday |
| Recommendation | SELL STOP |
| Entry Point | 0.6940 |
| Take Profit | 0.6900, 0.6870 |
| Stop Loss | 0.6980 |
| Key Levels | 0.6835, 0.6862, 0.6902, 0.6930, 0.6950, 0.6970, 0.6991, 0.7017, 0.7049, 0.7096, 0.7130 |
| Alternative scenario | |
|---|---|
| Recommendation | BUY STOP |
| Entry Point | 0.7000 |
| Take Profit | 0.7085 |
| Stop Loss | 0.6945 |
| Key Levels | 0.6835, 0.6862, 0.6902, 0.6930, 0.6950, 0.6970, 0.6991, 0.7017, 0.7049, 0.7096, 0.7130 |
Current trend
The pair continued to fall and is currently trading near the lows of December 2017.
Yesterday, the instrument showed a slight decrease, despite the negative data on inflation in the US. In April, the consumer price index rose from 2.4% to 2.5% YoY but the base consumer price index, the target for interest rate changes, remained at the same level of 2.1% instead of the expected growth. This statistics, along with the latest mixed data from the US labor market, alarms investors.
However, NZD remains weak against the backdrop of a prudent RBNZ policy. Monetary policy parameters have not changed for a year and a half, and the rate growth, according to the regulator, is possible in Q1 2020.
Today, a moderate influence on a pair may be exerted by the Fed's representative's James Bullard speech. The head of St. Louis Federal Reserve has repeatedly spoken out against a premature rate hike. Given yesterday's weak inflation and labor market indicators, the official's speech is likely to form a short-term pressure on the US currency.
Support and resistance
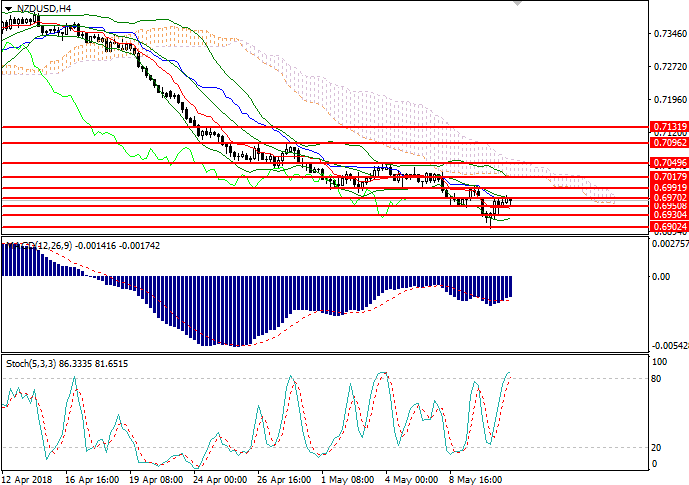
On the H4 chart, the instrument trades in a narrow range, testing the resistance level of 0.6970. Bollinger Bands are directed downwards, and the price range is reduced, indicating further correction within the narrow channel. MACD histogram is in the negative zone keeping a strong sell signal. Stochastic entered the overbought area, a sell signal can be formed during the day.
Support levels: 0.6835, 0.6862, 0.6902, 0.6930, 0.6950.
Resistance levels: 0.6970, 0.6991, 0.7017, 0.7049, 0.7096, 0.7130.
Trading tips
Short positions could be opened from the level of 0.6945 with targets at 0.6900, 0.6870 and stop-loss at 0.6980. Implementation period: 1-2 days.
Long positions may be opened from the level of 0.7000 with target at 0.7085 and stop-loss at 0.6945. Implementation period: 1-2 days.
The pair continued to fall and is currently trading near the lows of December 2017.
Yesterday, the instrument showed a slight decrease, despite the negative data on inflation in the US. In April, the consumer price index rose from 2.4% to 2.5% YoY but the base consumer price index, the target for interest rate changes, remained at the same level of 2.1% instead of the expected growth. This statistics, along with the latest mixed data from the US labor market, alarms investors.
However, NZD remains weak against the backdrop of a prudent RBNZ policy. Monetary policy parameters have not changed for a year and a half, and the rate growth, according to the regulator, is possible in Q1 2020.
Today, a moderate influence on a pair may be exerted by the Fed's representative's James Bullard speech. The head of St. Louis Federal Reserve has repeatedly spoken out against a premature rate hike. Given yesterday's weak inflation and labor market indicators, the official's speech is likely to form a short-term pressure on the US currency.
Support and resistance
On the H4 chart, the instrument trades in a narrow range, testing the resistance level of 0.6970. Bollinger Bands are directed downwards, and the price range is reduced, indicating further correction within the narrow channel. MACD histogram is in the negative zone keeping a strong sell signal. Stochastic entered the overbought area, a sell signal can be formed during the day.
Support levels: 0.6835, 0.6862, 0.6902, 0.6930, 0.6950.
Resistance levels: 0.6970, 0.6991, 0.7017, 0.7049, 0.7096, 0.7130.
Trading tips
Short positions could be opened from the level of 0.6945 with targets at 0.6900, 0.6870 and stop-loss at 0.6980. Implementation period: 1-2 days.
Long positions may be opened from the level of 0.7000 with target at 0.7085 and stop-loss at 0.6945. Implementation period: 1-2 days.


No comments:
Write comments