
Mastercard Inc. (MA/NYSE): general analysis
23 May 2018, 12:34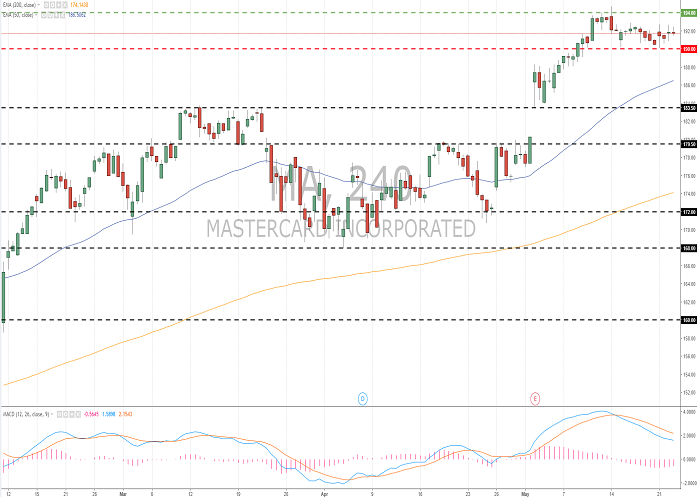
| Scenario | |
|---|---|
| Timeframe | Intraday |
| Recommendation | BUY STOP |
| Entry Point | 194.10 |
| Take Profit | 198.00, 202.00, 205.00 |
| Stop Loss | 190.00 |
| Key Levels | 179.50, 183.50, 190.00, 194.00 |
| Alternative scenario | |
|---|---|
| Recommendation | SELL STOP |
| Entry Point | 189.90 |
| Take Profit | 184.00, 180.00 |
| Stop Loss | 194.00 |
| Key Levels | 179.50, 183.50, 190.00, 194.00 |
Current trend
Mastercard stocks are trading near the historic maximum after the publication of a strong quarterly report above market expectations in early May. Since the beginning of the year, the growth of the price has far exceeded the dynamics of competitors in the industry, as it increased by 26.60% against the average growth by 14.27% in the financial services industry. Mastercard can strengthen further, considering the strong market position, the ongoing expansion, and digital initiatives.
During the last week, Mastercard decreased by 0.20% against the growth of S&P 500 index by 0.23%.
Support and resistance
The stocks are consolidating after quite a long growth. The instrument is testing its historical highs. Local support and resistance levels are 190.00 and 194.00 correspondingly. In the near future, a technical correction is not excluded. The indicators’ signals are mixed: the price consolidated above the MA (50) and MA (200); MACD is located in the negative zone. It is better to open the positions from the key levels.
The comparative analysis of the indicators of the company and its competitors suggests that the shares are underpriced.
Resistance levels: 194.00.
Support levels: 190.00, 183.50, 179.50.

Trading tips
Long positions can be opened after the price is set above the level of 194.00. The closing of the profitable positions is possible at the levels of 198.00, 202.00 and 205.00. Stop loss is 190.00.
Short positions can be opened after the price is set below 190.00 with the targets at 184.00 – 180.00. Stop loss is 194.00.
Implementation period: 3 days.
Mastercard stocks are trading near the historic maximum after the publication of a strong quarterly report above market expectations in early May. Since the beginning of the year, the growth of the price has far exceeded the dynamics of competitors in the industry, as it increased by 26.60% against the average growth by 14.27% in the financial services industry. Mastercard can strengthen further, considering the strong market position, the ongoing expansion, and digital initiatives.
During the last week, Mastercard decreased by 0.20% against the growth of S&P 500 index by 0.23%.
Support and resistance
The stocks are consolidating after quite a long growth. The instrument is testing its historical highs. Local support and resistance levels are 190.00 and 194.00 correspondingly. In the near future, a technical correction is not excluded. The indicators’ signals are mixed: the price consolidated above the MA (50) and MA (200); MACD is located in the negative zone. It is better to open the positions from the key levels.
The comparative analysis of the indicators of the company and its competitors suggests that the shares are underpriced.
Resistance levels: 194.00.
Support levels: 190.00, 183.50, 179.50.
Trading tips
Long positions can be opened after the price is set above the level of 194.00. The closing of the profitable positions is possible at the levels of 198.00, 202.00 and 205.00. Stop loss is 190.00.
Short positions can be opened after the price is set below 190.00 with the targets at 184.00 – 180.00. Stop loss is 194.00.
Implementation period: 3 days.


No comments:
Write comments