
Johnson & Johnson (JNJ/NYSE): general analysis
11 May 2018, 11:14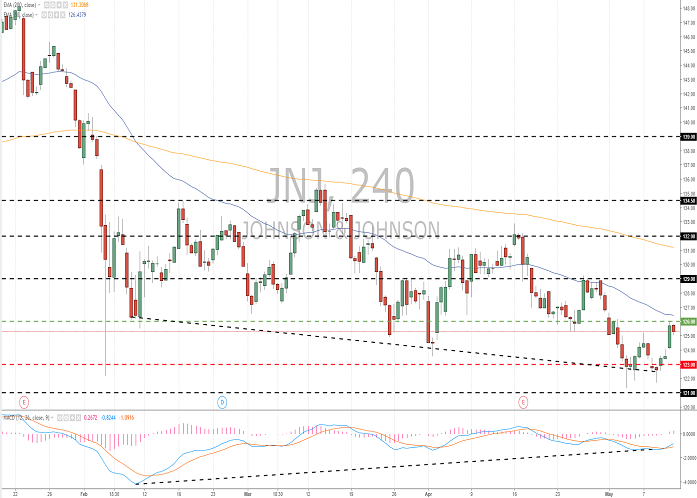
| Scenario | |
|---|---|
| Timeframe | Intraday |
| Recommendation | BUY STOP |
| Entry Point | 126.10 |
| Take Profit | 128.00, 130.00, 131.00 |
| Stop Loss | 124.00 |
| Key Levels | 121.00, 123.00, 126.00, 129.00, 132.00 |
| Alternative scenario | |
|---|---|
| Recommendation | SELL STOP |
| Entry Point | 122.90 |
| Take Profit | 120.00, 118.00 |
| Stop Loss | 125.00 |
| Key Levels | 121.00, 123.00, 126.00, 129.00, 132.00 |
Current trend
Johnson & Johnson stocks decreased by 14% from the historical peak of 148.18 USD and is now around 52-week lows. The decrease is due to key corporate news of the company. The quarterly report was quite positive. Regulatory and legal problems concerning opioids increased, however, last month Johnson & Johnson won the low suit, connected with Pinnacle implants. The recent growth in quarter dividends increases the dividend yield of the stocks to 3%. In the short term, the volatility can maintain, however, considering fundamental factors, Johnson & Johnson seems quite cheap.
During the last week, Johnson & Johnson grew by 1.89% against the growth of the S&P 500 index by 2.12%.
Support and resistance
The technical picture reflects the possibility of a correction after a significant decrease during last 3 months. The instrument is showing the classical reversal formation – the divergence of the price and MACD – for quite a long time. The key trading range is 123.00–126.00. The indicators’ signals are mixed: the price consolidated below МА (50) and МА (200); MACD histogram began to grow. It is better to open the positions from the key levels.
The comparative analysis of the indicators of the company and its competitors suggests the neutrality of its share prices.
Resistance levels: 126.00, 129.00, 132.00.
Support levels: 123.00, 121.00.

Trading tips
Long positions can be opened after the price is set above the level of 126.00. The closing of the profitable positions is possible at the levels of 128.00, 130.00 and 131.00. Stop loss is 124.00.
Short positions can be opened after the price is set below the level of 123.00 with the targets at 120.00–118.00. Stop loss is 125.00.
Implementation period: 3 days.
Johnson & Johnson stocks decreased by 14% from the historical peak of 148.18 USD and is now around 52-week lows. The decrease is due to key corporate news of the company. The quarterly report was quite positive. Regulatory and legal problems concerning opioids increased, however, last month Johnson & Johnson won the low suit, connected with Pinnacle implants. The recent growth in quarter dividends increases the dividend yield of the stocks to 3%. In the short term, the volatility can maintain, however, considering fundamental factors, Johnson & Johnson seems quite cheap.
During the last week, Johnson & Johnson grew by 1.89% against the growth of the S&P 500 index by 2.12%.
Support and resistance
The technical picture reflects the possibility of a correction after a significant decrease during last 3 months. The instrument is showing the classical reversal formation – the divergence of the price and MACD – for quite a long time. The key trading range is 123.00–126.00. The indicators’ signals are mixed: the price consolidated below МА (50) and МА (200); MACD histogram began to grow. It is better to open the positions from the key levels.
The comparative analysis of the indicators of the company and its competitors suggests the neutrality of its share prices.
Resistance levels: 126.00, 129.00, 132.00.
Support levels: 123.00, 121.00.
Trading tips
Long positions can be opened after the price is set above the level of 126.00. The closing of the profitable positions is possible at the levels of 128.00, 130.00 and 131.00. Stop loss is 124.00.
Short positions can be opened after the price is set below the level of 123.00 with the targets at 120.00–118.00. Stop loss is 125.00.
Implementation period: 3 days.


No comments:
Write comments