EUR/USD: general review
17 May 2018, 15:30
| Scenario | |
|---|---|
| Timeframe | Intraday |
| Recommendation | SELL STOP |
| Entry Point | 1.1775 |
| Take Profit | 1.1718, 1.1657 |
| Stop Loss | 1.1820 |
| Key Levels | 1.1657, 1.1718, 1.1780, 1.1840, 1.1962 |
| Alternative scenario | |
|---|---|
| Recommendation | BUY STOP |
| Entry Point | 1.1845 |
| Take Profit | 1.1962 |
| Stop Loss | 1.1810 |
| Key Levels | 1.1657, 1.1718, 1.1780, 1.1840, 1.1962 |
Current trend
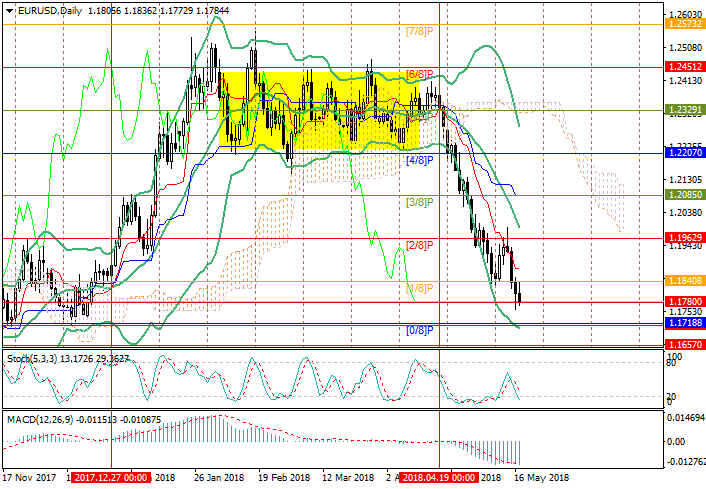
The pair resumed the decline and is currently testing 1.1780 mark.
Wednesday’s US construction data were poor. April Housing Starts decreased from 1.336 million to 1.287 million, Building Permits fall from 1.377 million to 1.352. However, in general, the trend is upward. USD is supported by positive Industrial Production release: in April, the indicator's growth exceeded forecasts amounting to 0.7%.
In the middle term, international tension cans weak USD: planned for the next month, meeting of US and DPRK can be canceled. The Korean Party is not satisfied by US demand of unilateral disarmament of DPRK and new military exercises of the USA and South Korea. Probably, the second round of the US-China trade talks in Washington will not bring significant results. At least, the American negotiators are pessimistic. Senate Finance Committee Chair Orrin Hatch noted today that additional duties on Chinese goods still have to be introduced. This will lead to the continuation of the trade war and weakening of USD.
Support and resistance
A breakdown of 1.1780 mark (Murray [2/8], H4) will give the prospect of further decline of the instrument to the levels of 1.1718 (Murray [0/8]) and 1.1657 (Murray [-2/8], H4). If the price consolidates above the level of 1.1840 (Murray [1/8]) one may expect the upward correction to the area of 1.1962 mark (Murray [2/8], the midline of Bollinger Bands)
Indicators confirm the decline: Stochastic and Bollinger Bands are directed downwards, MACD histogram is stable in the negative zone.
Support levels: 1.1780, 1.1718, 1.1657.
Resistance levels: 1.1840, 1.1962.

Trading tips
Sell positions may be opened below 1.1780 with targets at 1.1718, 1.1657 and stop-loss at 1.1820.
Buy positions may be opened above 1.1840 with the target at 1.1962 and stop-loss at 1.1810.
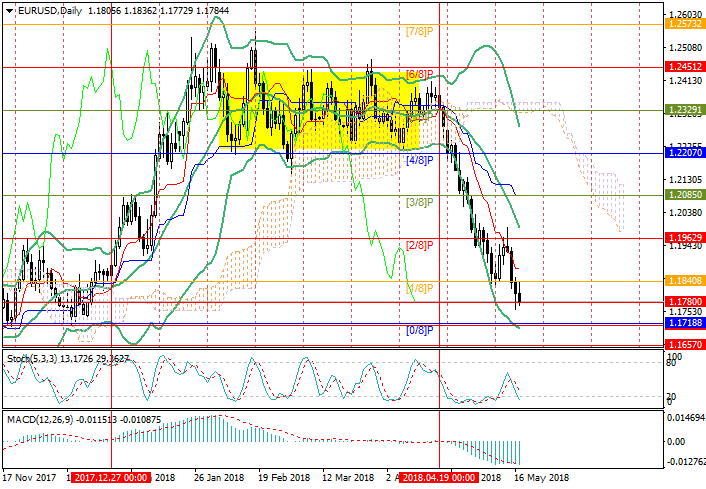
The pair resumed the decline and is currently testing 1.1780 mark.
Wednesday’s US construction data were poor. April Housing Starts decreased from 1.336 million to 1.287 million, Building Permits fall from 1.377 million to 1.352. However, in general, the trend is upward. USD is supported by positive Industrial Production release: in April, the indicator's growth exceeded forecasts amounting to 0.7%.
In the middle term, international tension cans weak USD: planned for the next month, meeting of US and DPRK can be canceled. The Korean Party is not satisfied by US demand of unilateral disarmament of DPRK and new military exercises of the USA and South Korea. Probably, the second round of the US-China trade talks in Washington will not bring significant results. At least, the American negotiators are pessimistic. Senate Finance Committee Chair Orrin Hatch noted today that additional duties on Chinese goods still have to be introduced. This will lead to the continuation of the trade war and weakening of USD.
Support and resistance
A breakdown of 1.1780 mark (Murray [2/8], H4) will give the prospect of further decline of the instrument to the levels of 1.1718 (Murray [0/8]) and 1.1657 (Murray [-2/8], H4). If the price consolidates above the level of 1.1840 (Murray [1/8]) one may expect the upward correction to the area of 1.1962 mark (Murray [2/8], the midline of Bollinger Bands)
Indicators confirm the decline: Stochastic and Bollinger Bands are directed downwards, MACD histogram is stable in the negative zone.
Support levels: 1.1780, 1.1718, 1.1657.
Resistance levels: 1.1840, 1.1962.

Trading tips
Sell positions may be opened below 1.1780 with targets at 1.1718, 1.1657 and stop-loss at 1.1820.
Buy positions may be opened above 1.1840 with the target at 1.1962 and stop-loss at 1.1810.


No comments:
Write comments