Ethereum: general review
17 May 2018, 13:22
| Scenario | |
|---|---|
| Timeframe | Weekly |
| Recommendation | SELL STOP |
| Entry Point | 670.00 |
| Take Profit | 625.00, 562.50 |
| Stop Loss | 720.00 |
| Key Levels | 562.50, 625.00, 687.50, 750.00, 812.50, 875.00 |
| Alternative scenario | |
|---|---|
| Recommendation | BUY STOP |
| Entry Point | 820.00 |
| Take Profit | 875.00, 950.00 |
| Stop Loss | 780.00 |
| Key Levels | 562.50, 625.00, 687.50, 750.00, 812.50, 875.00 |
Current trend
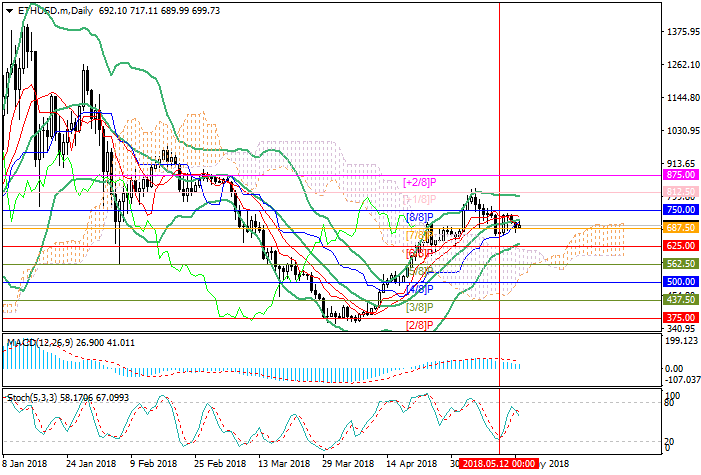
Ether quotes fell below the midline of Bollinger Bands to 687.50 mark but they cannot overcome it yet. The launch of the reference price tool for Ethereum by the CME Group was an element of preparation for the beginning of trading in futures, as reported by Tim McCourt, CME’s head of equity products. The company collects information, trying to assess the demand of investors for a new product.
At the Consensus 2018 blockchain conference ended in New York, representatives of American regulators also spoke. In particular, the Securities and Exchange Commission representative Robert Cohen noted that the SEC is open for dialogue with representatives of the digital assets industry and seeks to regulate financial markets, not technologies and innovations. Meanwhile, the regulator launched a training program identifying fraudulent ICO. For this purpose, the ICO of HoweyCoin tokens was created, which has all the signs of a fake. Market participants who try to invest in it will be redirected to the SEC's training services.
Support and resistance
The level of 687.50 (Murray [7/8]) is seen as key for "bears", in case of breakdown, the price may reach 625.00 (Murray [6/8]) and 562.50 (Murray [5/8]) marks. If the instrument consolidates above the May highs around 812.50 (Murray [+1/8], the upper line of Bollinger Bands) mark, quotes may rise. In this case, the price can reach 875.00 (Murray [+2/8]) and 950.00 marks.
Technical indicators show decline: MACD histogram is reducing in the negative zone, and Stochastic is reversing downwards.
Support levels: 687.50, 625.00, 562.50.
Resistance levels: 750.00, 812.50, 875.00.

Trading tips
Sell positions may be opened below 687.50 with targets at 625.00, 562.50 and stop-loss at 720.00.
Buy positions may be opened above 812.50 with targets at 875.00, 950.00 and stop-loss at 780.00.
Implementation time: 3-5 days.
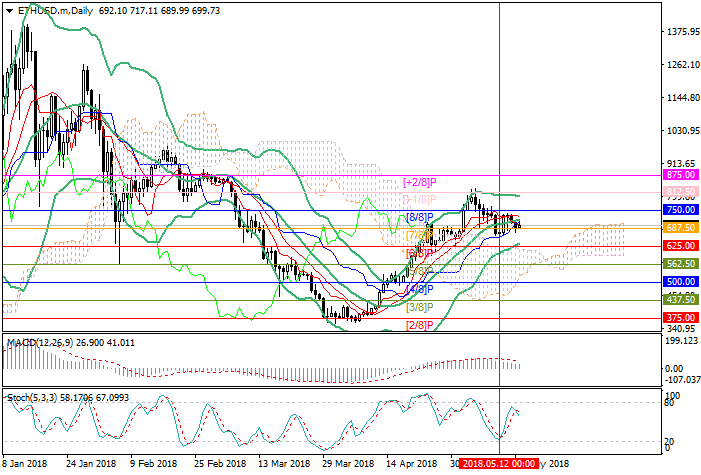
Ether quotes fell below the midline of Bollinger Bands to 687.50 mark but they cannot overcome it yet. The launch of the reference price tool for Ethereum by the CME Group was an element of preparation for the beginning of trading in futures, as reported by Tim McCourt, CME’s head of equity products. The company collects information, trying to assess the demand of investors for a new product.
At the Consensus 2018 blockchain conference ended in New York, representatives of American regulators also spoke. In particular, the Securities and Exchange Commission representative Robert Cohen noted that the SEC is open for dialogue with representatives of the digital assets industry and seeks to regulate financial markets, not technologies and innovations. Meanwhile, the regulator launched a training program identifying fraudulent ICO. For this purpose, the ICO of HoweyCoin tokens was created, which has all the signs of a fake. Market participants who try to invest in it will be redirected to the SEC's training services.
Support and resistance
The level of 687.50 (Murray [7/8]) is seen as key for "bears", in case of breakdown, the price may reach 625.00 (Murray [6/8]) and 562.50 (Murray [5/8]) marks. If the instrument consolidates above the May highs around 812.50 (Murray [+1/8], the upper line of Bollinger Bands) mark, quotes may rise. In this case, the price can reach 875.00 (Murray [+2/8]) and 950.00 marks.
Technical indicators show decline: MACD histogram is reducing in the negative zone, and Stochastic is reversing downwards.
Support levels: 687.50, 625.00, 562.50.
Resistance levels: 750.00, 812.50, 875.00.

Trading tips
Sell positions may be opened below 687.50 with targets at 625.00, 562.50 and stop-loss at 720.00.
Buy positions may be opened above 812.50 with targets at 875.00, 950.00 and stop-loss at 780.00.
Implementation time: 3-5 days.


No comments:
Write comments