
EUR/USD: the euro is declining
24 May 2018, 09:27
| Scenario | |
|---|---|
| Timeframe | Intraday |
| Recommendation | BUY STOP |
| Entry Point | 1.1745 |
| Take Profit | 1.1860, 1.1900 |
| Stop Loss | 1.1690, 1.1680 |
| Key Levels | 1.1600, 1.1622, 1.1672, 1.1741, 1.1800, 1.1860, 1.1900 |
| Alternative scenario | |
|---|---|
| Recommendation | SELL STOP |
| Entry Point | 1.1665 |
| Take Profit | 1.1600 |
| Stop Loss | 1.1720 |
| Key Levels | 1.1600, 1.1622, 1.1672, 1.1741, 1.1800, 1.1860, 1.1900 |
Current trend
EUR declined against USD on Wednesday, noting a new local minimum since November 14, 2017.
On Wednesday, the European currency was generally pressured by negative data on business activity indices for the Eurozone and Germany. In May, the indicators fell more than expected by market participants. Services PMI for Germany amounted to 52.1 points, and for the Eurozone — to 53.9 points, both figures have been continuously declining since January. Manufacturing PMI for Germany was 56.8 points, and for the Eurozone — 54.1 points, both figures are decreasing since December. Generally, the European economy shows a slowdown.
On Thursday, investors are waiting for the publication of data on Germany's GDP in Q1. The indicators are expected to remain the same. In quarterly terms, GDP growth will be 0.3%, and in annual terms — 2.3%.
Support and resistance
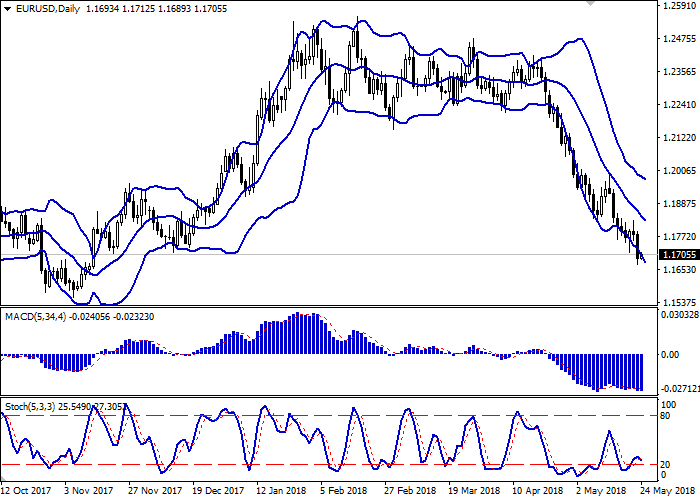
Bollinger Bands in D1 chart decrease. The price range is widening but does not conform to the development of the "bearish" trend.
MACD reverses downwards having formed a sell signal (located below the signal line).
Stochastic, after a short period of growth, is prone to declining, reacting to a surge of "bearish" sentiments.
Technical indicators do not contradict further development of the "bearish" trend in the short and/or ultra-short term. Nevertheless, developing of corrective growth at the end of the current week is possible.
Resistance levels: 1.1741, 1.1800, 1.1860, 1.1900.
Support levels: 1.1672, 1.1622, 1.1600.

Trading tips
To open long positions, one can rely on the rebound from the support level of 1.1672, with the subsequent breakout of the 1.1741 mark. Take-profit – 1.1860, 1.1900. Stop-loss – 1.1690, 1.1680. Implementation period: 2-3 days.
The breakdown of the level of 1.1672 may serve as a signal to the beginning of sales with the target at 1.1600. Stop-loss – 1.1720. Implementation period: 1-2 days.
EUR declined against USD on Wednesday, noting a new local minimum since November 14, 2017.
On Wednesday, the European currency was generally pressured by negative data on business activity indices for the Eurozone and Germany. In May, the indicators fell more than expected by market participants. Services PMI for Germany amounted to 52.1 points, and for the Eurozone — to 53.9 points, both figures have been continuously declining since January. Manufacturing PMI for Germany was 56.8 points, and for the Eurozone — 54.1 points, both figures are decreasing since December. Generally, the European economy shows a slowdown.
On Thursday, investors are waiting for the publication of data on Germany's GDP in Q1. The indicators are expected to remain the same. In quarterly terms, GDP growth will be 0.3%, and in annual terms — 2.3%.
Support and resistance
Bollinger Bands in D1 chart decrease. The price range is widening but does not conform to the development of the "bearish" trend.
MACD reverses downwards having formed a sell signal (located below the signal line).
Stochastic, after a short period of growth, is prone to declining, reacting to a surge of "bearish" sentiments.
Technical indicators do not contradict further development of the "bearish" trend in the short and/or ultra-short term. Nevertheless, developing of corrective growth at the end of the current week is possible.
Resistance levels: 1.1741, 1.1800, 1.1860, 1.1900.
Support levels: 1.1672, 1.1622, 1.1600.
Trading tips
To open long positions, one can rely on the rebound from the support level of 1.1672, with the subsequent breakout of the 1.1741 mark. Take-profit – 1.1860, 1.1900. Stop-loss – 1.1690, 1.1680. Implementation period: 2-3 days.
The breakdown of the level of 1.1672 may serve as a signal to the beginning of sales with the target at 1.1600. Stop-loss – 1.1720. Implementation period: 1-2 days.


No comments:
Write comments