
EUR/USD: EUR remains under pressure
09 May 2018, 10:01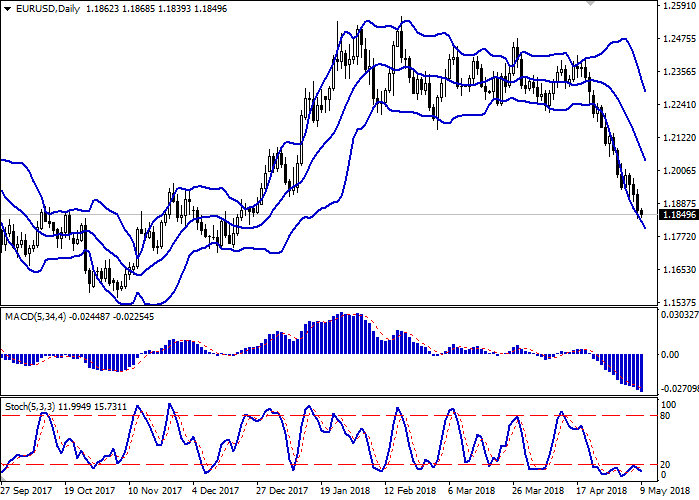
| Scenario | |
|---|---|
| Timeframe | Intraday |
| Recommendation | BUY STOP |
| Entry Point | 1.1910 |
| Take Profit | 1.2000 |
| Stop Loss | 1.1850, 1.1830 |
| Key Levels | 1.1755, 1.1800, 1.1835, 1.1860, 1.1900, 1.1936, 1.1957 |
| Alternative scenario | |
|---|---|
| Recommendation | SELL |
| Entry Point | 1.1826 |
| Take Profit | 1.1755 |
| Stop Loss | 1.1880 |
| Key Levels | 1.1755, 1.1800, 1.1835, 1.1860, 1.1900, 1.1936, 1.1957 |
Current trend
The European currency substantially decreased against the US dollar during trading on Tuesday, having updated local lows since December 22.
The focus of investors was the statistics on exports, imports, and dynamics of industrial production in Germany. Also, data from China had a significant impact on the trading. German statistics was positive. March Industrial Production grew by 1.0% MoM and by 3.2% YoY, exceeding the expectations. Trade Balance surplus increased from 19.2 to 22.0 billion EUR, mainly due to the decrease of import in Germany (by 0.9% in March).
On May 9, quite a few interesting publications from the Eurozone are expected, so investors are likely to focus on US data. In particular, they will be interested in April statistics on producer price indices.
Support and resistance
Bollinger Bands in D1 chart demonstrate a stable decrease. The price range is slightly narrowed from above, freeing the way to new local lows for "bears".
MACD is going down preserving a stable sell signal (being located under the signal line).
Stochastic shows oscillatory dynamics, for a long time being near its minimum levels. Current showings indicate the oversold euro in the short term.
At the moment, the indicators do not form clear trade signals for the corrective dynamics. One should keep existing sales in the short to medium term.
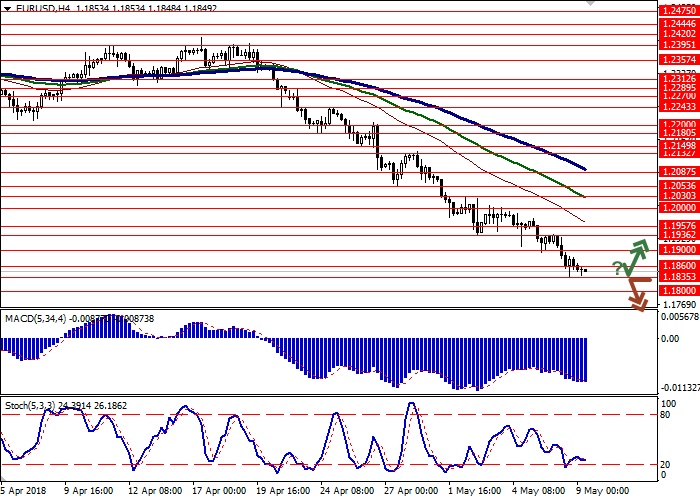
Resistance levels: 1.1860, 1.1900, 1.1936, 1.1957.
Support levels: 1.1835, 1.1800, 1.1755.

Trading tips
Long positions may be opened if the price moves away from 1.1835 mark, as from support, followed by the breakout of 1.1900 mark. Take-profit — 1.2000. Stop-loss – 1.1850-1.1830. Implementation time: 2-3 days.
The breakdown of the level of 1.1835 may serve as a signal to the beginning of sales with the target at 1.1755. Stop-loss – 1.1880. Implementation time: 2 days.
The European currency substantially decreased against the US dollar during trading on Tuesday, having updated local lows since December 22.
The focus of investors was the statistics on exports, imports, and dynamics of industrial production in Germany. Also, data from China had a significant impact on the trading. German statistics was positive. March Industrial Production grew by 1.0% MoM and by 3.2% YoY, exceeding the expectations. Trade Balance surplus increased from 19.2 to 22.0 billion EUR, mainly due to the decrease of import in Germany (by 0.9% in March).
On May 9, quite a few interesting publications from the Eurozone are expected, so investors are likely to focus on US data. In particular, they will be interested in April statistics on producer price indices.
Support and resistance
Bollinger Bands in D1 chart demonstrate a stable decrease. The price range is slightly narrowed from above, freeing the way to new local lows for "bears".
MACD is going down preserving a stable sell signal (being located under the signal line).
Stochastic shows oscillatory dynamics, for a long time being near its minimum levels. Current showings indicate the oversold euro in the short term.
At the moment, the indicators do not form clear trade signals for the corrective dynamics. One should keep existing sales in the short to medium term.
Resistance levels: 1.1860, 1.1900, 1.1936, 1.1957.
Support levels: 1.1835, 1.1800, 1.1755.
Trading tips
Long positions may be opened if the price moves away from 1.1835 mark, as from support, followed by the breakout of 1.1900 mark. Take-profit — 1.2000. Stop-loss – 1.1850-1.1830. Implementation time: 2-3 days.
The breakdown of the level of 1.1835 may serve as a signal to the beginning of sales with the target at 1.1755. Stop-loss – 1.1880. Implementation time: 2 days.


No comments:
Write comments