
Ethereum: Murray analysis
08 May 2018, 13:31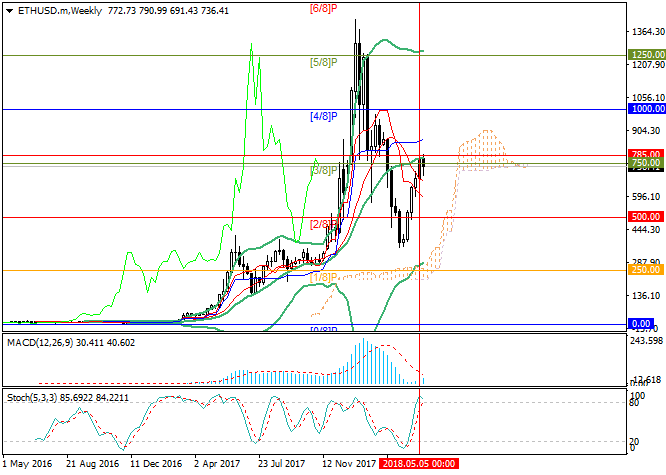
| Scenario | |
|---|---|
| Timeframe | Weekly |
| Recommendation | SELL STOP |
| Entry Point | 680.00 |
| Take Profit | 625.00, 562.50 |
| Stop Loss | 720.00 |
| Key Levels | 562.50, 625.00, 687.50, 812.50, 875.00, 940.00 |
| Alternative scenario | |
|---|---|
| Recommendation | BUY STOP |
| Entry Point | 813.00 |
| Take Profit | 875.00, 940.00 |
| Stop Loss | 770.00 |
| Key Levels | 562.50, 625.00, 687.50, 812.50, 875.00, 940.00 |
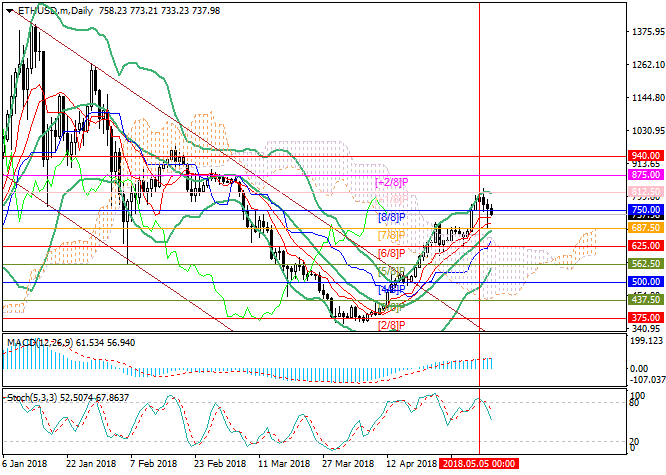
On the daily chart, the price is trying to enter the downward correction and
is testing the level of 750.00 ([8/8]). A significant fall will be possible
after the breakdown of the level 687.50 ([7/8], the middle line of Bollinger
Bands). In this case, the “bearish” targets will be the level of 625.00 ([6/8])
and 562.50 ([5/8], the lower border of Bollinger Bands). If the price
consolidates above May’s highs around 812.50 ([+1/8]), the growth to the levels
of 875.00 ([+2/8]) and 940.00 is possible. Technical indicators do not give a
clear signal. MACD histogram is stable in the positive zone. Stochastic is
pointed downwards.
On the weekly chart, the price stopped near the middle line of Bollinger Bands and cannot go upwards. As Stochastic is trying to reverse in the overbought area, the instrument can begin to fall to the level of 500.00 ([2/8]) in the middle term. If the price consolidates above the middle line of Bollinger Bands around 785.00, it can go up to the level of 1000.00 ([4/8]).
Support and resistance
Resistance levels: 812.50 ([+1/8]), 875.00 ([+2/8]), 940.00.
Support levels: 687.50 ([7/8]), 625.00 ([6/8]), 562.50 ([5/8]).

Trading tips
Short positions can be opened below the level of 687.50 with the targets at 625.00, 562.50 and stop loss around 720.00.
Long positions can be opened at the level of 813.00 with the targets at 875.00, 940.00 and stop loss near the level of 770.00.
Implementation period: 5–7 days.
On the weekly chart, the price stopped near the middle line of Bollinger Bands and cannot go upwards. As Stochastic is trying to reverse in the overbought area, the instrument can begin to fall to the level of 500.00 ([2/8]) in the middle term. If the price consolidates above the middle line of Bollinger Bands around 785.00, it can go up to the level of 1000.00 ([4/8]).
Support and resistance
Resistance levels: 812.50 ([+1/8]), 875.00 ([+2/8]), 940.00.
Support levels: 687.50 ([7/8]), 625.00 ([6/8]), 562.50 ([5/8]).
Trading tips
Short positions can be opened below the level of 687.50 with the targets at 625.00, 562.50 and stop loss around 720.00.
Long positions can be opened at the level of 813.00 with the targets at 875.00, 940.00 and stop loss near the level of 770.00.
Implementation period: 5–7 days.


No comments:
Write comments