
Brent Crude Oil: general review
23 May 2018, 10:45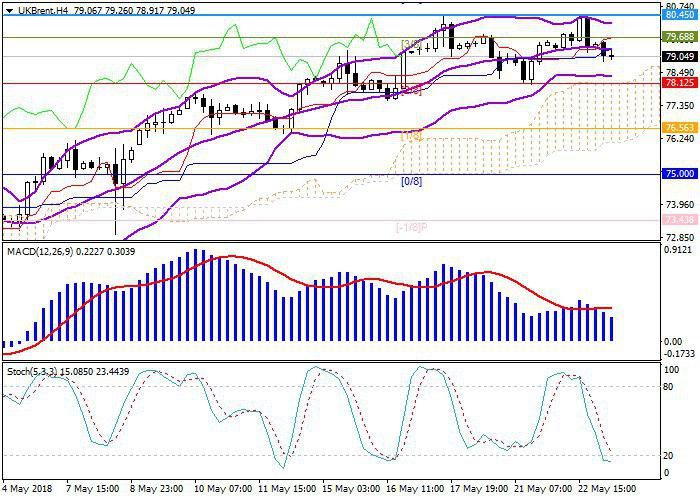
| Scenario | |
|---|---|
| Timeframe | Intraday |
| Recommendation | SELL |
| Entry Point | 79.00 |
| Take Profit | 78.12 |
| Stop Loss | 79.55 |
| Key Levels | 75.00, 76.56, 78.12, 80.45, 81.25, 82.00 |
| Alternative scenario | |
|---|---|
| Recommendation | BUY STOP |
| Entry Point | 79.75 |
| Take Profit | 80.45, 81.25 |
| Stop Loss | 79.30 |
| Key Levels | 75.00, 76.56, 78.12, 80.45, 81.25, 82.00 |
Current trend
Brent quotes, after testing the local high at the level of 84.50, corrected downwards. Published on Tuesday, the API report showed a reduction in US oil reserves by 1,300 million barrels per week, but could not support the instrument.
OPEC representatives reported on a possible increase in the production of "black gold" due to the likely reduction in exports of raw materials from Iran and Venezuela, which puts a certain pressure on the market. According to OPEC, this decision can be made in June.
On Wednesday, investors will pay attention to official data from the US Department of Energy on the weekly change in the level of reserves and oil production in the country.
Support and resistance
Technical indicators point at the moderate preservation of the downward trend. Bollinger Bands have a slight downward slope. MACD volumes decrease in the positive zone. Stochastic lines are directed downwards.
The price fell below the midline of Bollinger Bands (79.30) and, while maintaining current dynamics, may fall to the area of the level of 78.12. One may speak about resuming growth after the price consolidates above the level of 79.68.
Support levels: 78.12, 76.56, 75.00.
Resistance levels: 80.45, 81.25, 82.00.
Trading tips
Sell positions may be opened below the level of 79.30 with target at 78.12 and stop-loss at 79.55.
Buy positions may be opened above the level of 79.68 with targets at 80.45–81.25 and stop-loss at 79.30.
Brent quotes, after testing the local high at the level of 84.50, corrected downwards. Published on Tuesday, the API report showed a reduction in US oil reserves by 1,300 million barrels per week, but could not support the instrument.
OPEC representatives reported on a possible increase in the production of "black gold" due to the likely reduction in exports of raw materials from Iran and Venezuela, which puts a certain pressure on the market. According to OPEC, this decision can be made in June.
On Wednesday, investors will pay attention to official data from the US Department of Energy on the weekly change in the level of reserves and oil production in the country.
Support and resistance
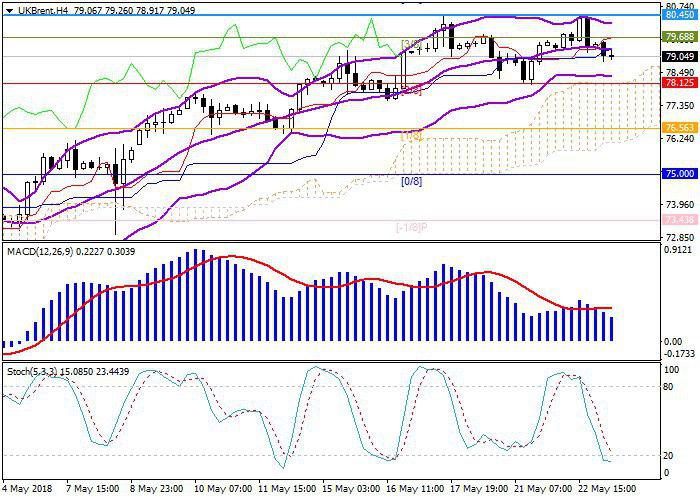
Technical indicators point at the moderate preservation of the downward trend. Bollinger Bands have a slight downward slope. MACD volumes decrease in the positive zone. Stochastic lines are directed downwards.
The price fell below the midline of Bollinger Bands (79.30) and, while maintaining current dynamics, may fall to the area of the level of 78.12. One may speak about resuming growth after the price consolidates above the level of 79.68.
Support levels: 78.12, 76.56, 75.00.
Resistance levels: 80.45, 81.25, 82.00.
Trading tips
Sell positions may be opened below the level of 79.30 with target at 78.12 and stop-loss at 79.55.
Buy positions may be opened above the level of 79.68 with targets at 80.45–81.25 and stop-loss at 79.30.


No comments:
Write comments