
Bitcoin: technical analysis
16 May 2018, 11:26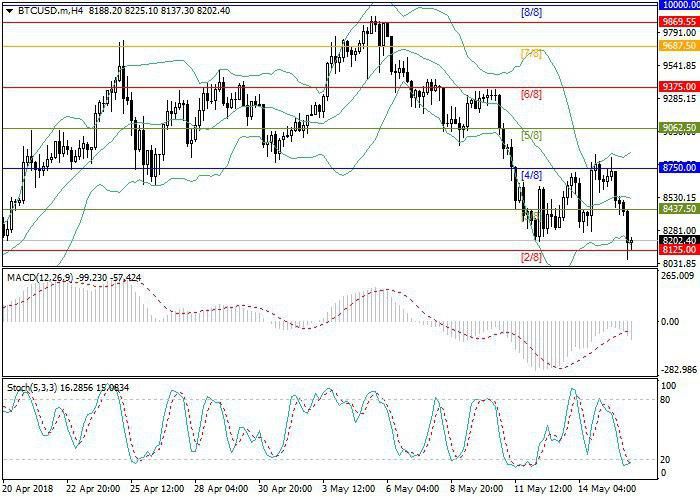
| Scenario | |
|---|---|
| Timeframe | Intraday |
| Recommendation | SELL STOP |
| Entry Point | 8100.00 |
| Take Profit | 7812.50, 7500.00 |
| Stop Loss | 8300.00 |
| Key Levels | 7500.00, 7812.50, 8125.00, 8437.50, 8750.00, 9062.50 |
| Alternative scenario | |
|---|---|
| Recommendation | BUY STOP |
| Entry Point | 8550.00 |
| Take Profit | 8750.00, 9062.50 |
| Stop Loss | 8380.00 |
| Key Levels | 7500.00, 7812.50, 8125.00, 8437.50, 8750.00, 9062.50 |
Current trend
Bitcoin prices weakened to the area of the level of 8125.00 (Murray [2/8]). After an unsuccessful test of it, a slight correction is developing, but the downward movement potential still maintains. The breakdown of the level 8125.00 will let Bitcoin fall to the area of 7812.50 (Murray [1/8])–7500.00 (Murray [0/8]). 7500.00 is a strong support level, where the reversal and the formation of the upward trend are possible. However, the breakout of it will let the price fall further to the area of 7187.50 (Murray [–1/8])–6875.00 (Murray [–2/8]). The restoration of the growth is possible after the price is set above the level of the middle line of Bollinger Bands (8515.00), which will let the instrument strengthen to the levels of 8750.00 (Murray [4/8])–9062.50 (Murray [5/8]).
Technical indicators mostly keep the sell signal. Bollinger Bands are diverging, reflecting the active development of the current downward trend. MACD volumes are growing in the negative zone, forming the sell signal. Stochastic lines are in the oversold area and are pointed sideways.
Support and resistance
Resistance levels: 8437.50, 8750.00, 9062.50.
Support levels: 8125.00, 7812.50, 7500.00.
Trading tips
Short positions can be opened below the level of 8125.00 with the targets at around 7812.50–7500.00 and stop loss 8300.00.
Long positions can be opened above the level of 8515.00 with the targets at around 8750.00–9062.50 and stop loss 8380.00.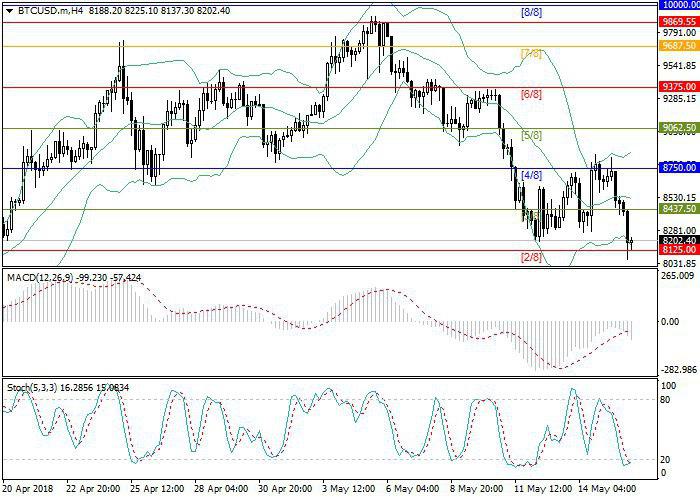


No comments:
Write comments