
Alibaba Group Holding Ltd. (BABA/NYSE): general analysis
14 May 2018, 10:53
| Scenario | |
|---|---|
| Timeframe | Intraday |
| Recommendation | BUY STOP |
| Entry Point | 199.10 |
| Take Profit | 203.00, 207.00, 210.00 |
| Stop Loss | 195.00 |
| Key Levels | 177.00, 184.00, 192.00,199.00, 205.00 |
| Alternative scenario | |
|---|---|
| Recommendation | SELL STOP |
| Entry Point | 191.90 |
| Take Profit | 184.00, 182.00 |
| Stop Loss | 196.00 |
| Key Levels | 177.00, 184.00, 192.00,199.00, 205.00 |
Current trend
Alibaba Group stocks have grown by 6.5% since the release of the strong Q4 of the financial 2018 year on May 4. They are now trading around 3-months maximum. The income of the internet retailer grew by 76% YoY to 9.9 billion USD, exceeding The Wall Street expectations of 9.2 billion. The corrected EPS grew by 44.4% YoY to 0.91 USD, also exceeding the market expectations. Moreover, Alibaba Group expects 60% growth of the profit in the financial 2019 year.
During the last week, Alibaba Group grew by 2.90% against the growth of the S&P 500 index by 0.31%.
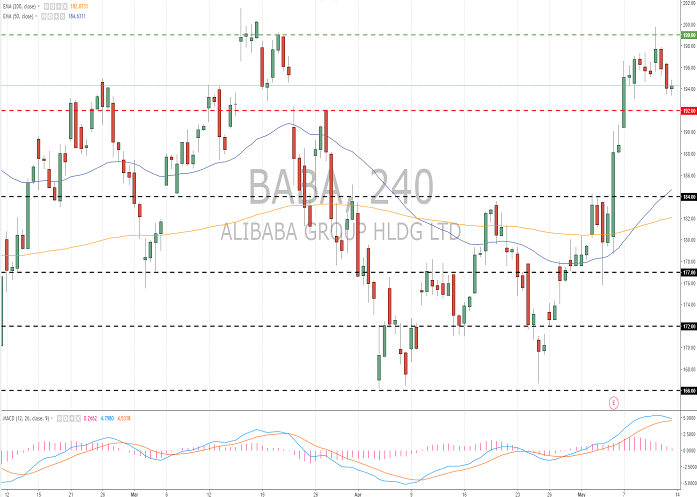
Support and resistance
The stocks are now consolidating after significant growth during last three weeks. The key support and resistance levels are 192.00 and 199.00 correspondingly. The technical correction is not excluded in the nearest future. The indicators’ signals are mixed: the price consolidated above МА (50) and МА (200); MACD histogram began to fall. It is better to open the positions from the key levels.
The comparative analysis of the indicators of the company and its competitors suggests the neutrality of its share prices.
Resistance levels: 199.00, 205.00.
Support levels: 192.00, 184.00, 177.00.
Trading tips
Long positions can be opened after the price is set above the level of 199.00. The closing of the profitable positions is possible at the levels of 203.00, 207.00 and 210.00. Stop loss is 195.00.
Short positions can be opened after the price is set below the level of 192.00 with the targets at 184.00–182.00. Stop loss is 196.00.
Implementation period: 3 days.
Alibaba Group stocks have grown by 6.5% since the release of the strong Q4 of the financial 2018 year on May 4. They are now trading around 3-months maximum. The income of the internet retailer grew by 76% YoY to 9.9 billion USD, exceeding The Wall Street expectations of 9.2 billion. The corrected EPS grew by 44.4% YoY to 0.91 USD, also exceeding the market expectations. Moreover, Alibaba Group expects 60% growth of the profit in the financial 2019 year.
During the last week, Alibaba Group grew by 2.90% against the growth of the S&P 500 index by 0.31%.
Support and resistance
The stocks are now consolidating after significant growth during last three weeks. The key support and resistance levels are 192.00 and 199.00 correspondingly. The technical correction is not excluded in the nearest future. The indicators’ signals are mixed: the price consolidated above МА (50) and МА (200); MACD histogram began to fall. It is better to open the positions from the key levels.
The comparative analysis of the indicators of the company and its competitors suggests the neutrality of its share prices.
Resistance levels: 199.00, 205.00.
Support levels: 192.00, 184.00, 177.00.
Trading tips
Long positions can be opened after the price is set above the level of 199.00. The closing of the profitable positions is possible at the levels of 203.00, 207.00 and 210.00. Stop loss is 195.00.
Short positions can be opened after the price is set below the level of 192.00 with the targets at 184.00–182.00. Stop loss is 196.00.
Implementation period: 3 days.


No comments:
Write comments