
XAU/USD: gold is going down
06 April 2018, 09:28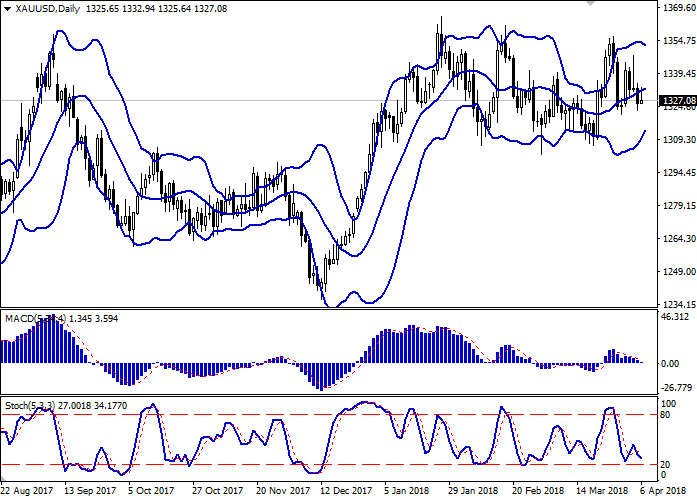
| Scenario | |
|---|---|
| Timeframe | Intraday |
| Recommendation | BUY STOP |
| Entry Point | 1333.00 |
| Take Profit | 1340.68, 1344.35 |
| Stop Loss | 1327.00 |
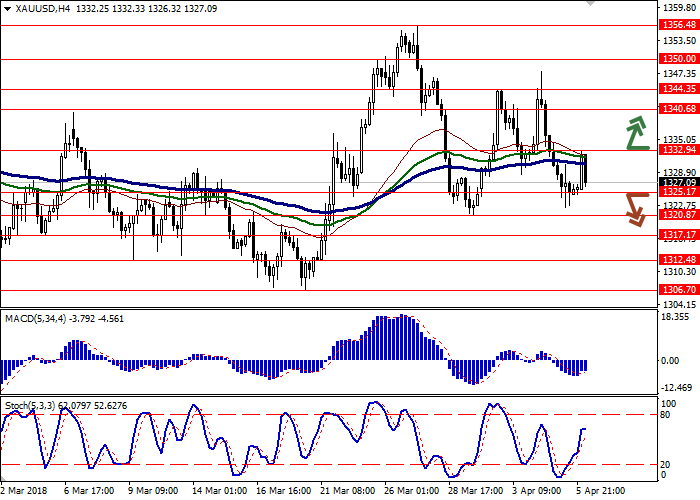
| Key Levels | 1312.48, 1317.17, 1320.87, 1325.17, 1332.94, 1340.68, 1344.35, 1350.00 |
| Alternative scenario | |
|---|---|
| Recommendation | SELL STOP |
| Entry Point | 1325.10 |
| Take Profit | 1317.17, 1312.48 |
| Stop Loss | 1330.00 |
| Key Levels | 1312.48, 1317.17, 1320.87, 1325.17, 1332.94, 1340.68, 1344.35, 1350.00 |
Current trend
Yesterday, gold quotes drastically slipped at the trading, after it became known about the readiness of the US and China to resolve most of the trade disagreements through negotiations. Demand for risky assets also increased amid expectations of publication of the March report on the US labor market on Friday.
Nonfarm Payroll can rapidly fall from 313K to 190K. The unemployment rate can decrease from 4.1% to 4.0%. Average Hourly Earnings is expected to grow from 2.6% to 2.7%. A strong report may prove to be an additional stimulus for the Fed to raise interest rates more aggressively. Recall that the regulator still expects at least two more rate increases in 2018, but previously, investors announced the possibility of more rapid growth under favorable circumstances.
Support and resistance
On the D1 chart Bollinger Bands demonstrate a tendency to turn in a horizontal plane. The price range is narrowing sharply, reflecting the mixed nature of trading in the short term.
MACD is going down preserving a weak sell signal (histogram is located below the signal line).
Stochastic keeps its downward direction but is approaching its minimum marks, which may reflect the risks of a corrective growth in the short term.
Resistance levels: 1332.94, 1340.68, 1344.35, 1350.00.
Support levels: 1325.17, 1320.87, 1317.17, 1312.48.

Trading tips
To open long positions one can be based on the breakout of the level of 1332.94, while maintaining "bullish" signals from technical indicators. Take-profit – 1340.68 or 1344.35. Stop-loss – 1327.00. Implementation period: 2-3 days.
The return of "bearish" trend with the breakdown of the level of 1325.17 may become a signal for new sales with the targets at 1317.17 or 1312.48. Stop-loss should be placed no further than 1330.00. Implementation period: 2-3 days.
Yesterday, gold quotes drastically slipped at the trading, after it became known about the readiness of the US and China to resolve most of the trade disagreements through negotiations. Demand for risky assets also increased amid expectations of publication of the March report on the US labor market on Friday.
Nonfarm Payroll can rapidly fall from 313K to 190K. The unemployment rate can decrease from 4.1% to 4.0%. Average Hourly Earnings is expected to grow from 2.6% to 2.7%. A strong report may prove to be an additional stimulus for the Fed to raise interest rates more aggressively. Recall that the regulator still expects at least two more rate increases in 2018, but previously, investors announced the possibility of more rapid growth under favorable circumstances.
Support and resistance
On the D1 chart Bollinger Bands demonstrate a tendency to turn in a horizontal plane. The price range is narrowing sharply, reflecting the mixed nature of trading in the short term.
MACD is going down preserving a weak sell signal (histogram is located below the signal line).
Stochastic keeps its downward direction but is approaching its minimum marks, which may reflect the risks of a corrective growth in the short term.
Resistance levels: 1332.94, 1340.68, 1344.35, 1350.00.
Support levels: 1325.17, 1320.87, 1317.17, 1312.48.
Trading tips
To open long positions one can be based on the breakout of the level of 1332.94, while maintaining "bullish" signals from technical indicators. Take-profit – 1340.68 or 1344.35. Stop-loss – 1327.00. Implementation period: 2-3 days.
The return of "bearish" trend with the breakdown of the level of 1325.17 may become a signal for new sales with the targets at 1317.17 or 1312.48. Stop-loss should be placed no further than 1330.00. Implementation period: 2-3 days.


No comments:
Write comments