USD/CAD: the US dollar is declining
05 April 2018, 10:01
| Scenario | |
|---|---|
| Timeframe | Intraday |
| Recommendation | BUY STOP |
| Entry Point | 1.2810 |
| Take Profit | 1.2900 |
| Stop Loss | 1.2750, 1.2744 |
| Key Levels | 1.2647, 1.2700, 1.2744, 1.2800, 1.2846, 1.2900, 1.2947 |
| Alternative scenario | |
|---|---|
| Recommendation | SELL STOP |
| Entry Point | 1.2740 |
| Take Profit | 1.2700, 1.2650 |
| Stop Loss | 1.2780 |
| Key Levels | 1.2647, 1.2700, 1.2744, 1.2800, 1.2846, 1.2900, 1.2947 |
Current trend
USD lost to CAD on Wednesday, noting a new local minimum since February 27. Demand for the US currency remains under pressure, despite the continued growth in the US bonds yield.
The reason for cautious sentiment remains the tense situation surrounding US-China trade relations, as well as uncertain macroeconomic statistics from the US.
However, the market expects the publication of reports on labor markets in the US and Canada on Friday, and despite the low forecasts for US data, real statistics may be stronger. The ADP report released yesterday indicated that employment in the private sector in the US increased by 241K jobs in March, which is only 5K less than in the previous month. Investors expected only +205K jobs.
Support and resistance
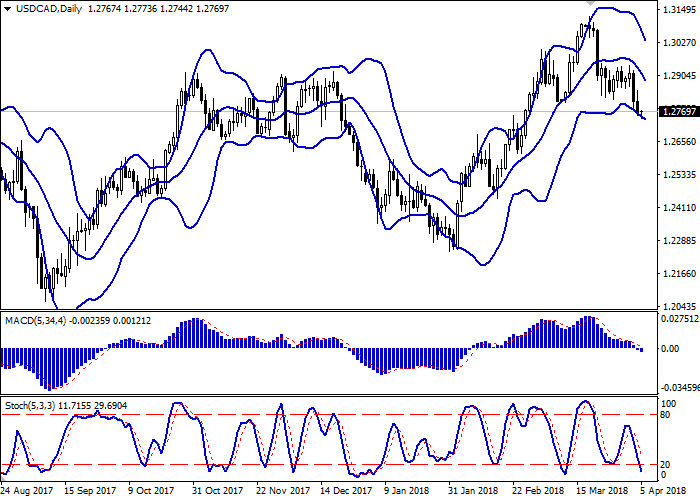
Bollinger Bands in D1 chart demonstrate a stable decrease. The price range is narrowing, reflecting some slowdown in the "bearish" trend that emerged on April 3.
MACD is going down preserving a stable sell signal (histogram being located below the signal line). In addition, the indicator is trying to gain a foothold below the zero mark at the moment.
Stochastic is declining and is approaching its minimum marks, indicating the oversold USD in the short or ultra-short term.
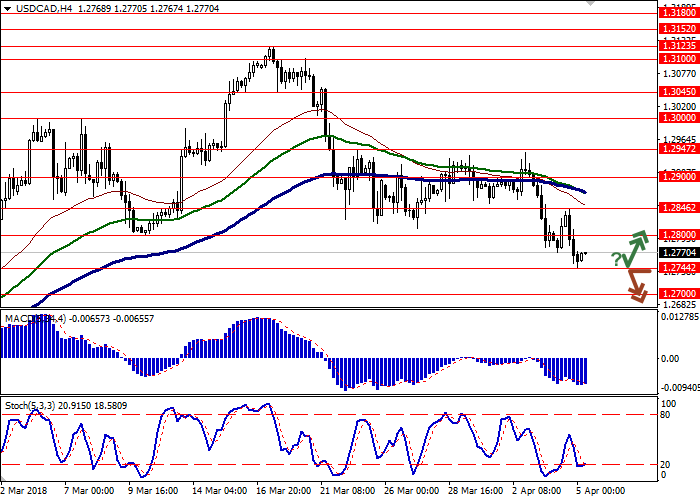
Resistance levels: 1.2800, 1.2846, 1.2900, 1.2947.
Support levels: 1.2744, 1.2700, 1.2647.


Trading tips
To open long positions, one can rely on the rebound from the support level of 1.2744, with the subsequent breakout of the 1.2800 mark. Take-profit – 1.2900. Stop-loss — 1.2750, 1.2744. Implementation period: 2-3 days.
A confident breakdown of the level of 1.2744 may be a signal to further sales with targets at 1.2700 or 1.2650 marks. Stop-loss – 1.2780. Implementation period: 1-3 days.
USD lost to CAD on Wednesday, noting a new local minimum since February 27. Demand for the US currency remains under pressure, despite the continued growth in the US bonds yield.
The reason for cautious sentiment remains the tense situation surrounding US-China trade relations, as well as uncertain macroeconomic statistics from the US.
However, the market expects the publication of reports on labor markets in the US and Canada on Friday, and despite the low forecasts for US data, real statistics may be stronger. The ADP report released yesterday indicated that employment in the private sector in the US increased by 241K jobs in March, which is only 5K less than in the previous month. Investors expected only +205K jobs.
Support and resistance
Bollinger Bands in D1 chart demonstrate a stable decrease. The price range is narrowing, reflecting some slowdown in the "bearish" trend that emerged on April 3.
MACD is going down preserving a stable sell signal (histogram being located below the signal line). In addition, the indicator is trying to gain a foothold below the zero mark at the moment.
Stochastic is declining and is approaching its minimum marks, indicating the oversold USD in the short or ultra-short term.
Resistance levels: 1.2800, 1.2846, 1.2900, 1.2947.
Support levels: 1.2744, 1.2700, 1.2647.


Trading tips
To open long positions, one can rely on the rebound from the support level of 1.2744, with the subsequent breakout of the 1.2800 mark. Take-profit – 1.2900. Stop-loss — 1.2750, 1.2744. Implementation period: 2-3 days.
A confident breakdown of the level of 1.2744 may be a signal to further sales with targets at 1.2700 or 1.2650 marks. Stop-loss – 1.2780. Implementation period: 1-3 days.


No comments:
Write comments