NZD/USD: New Zealand dollar is growing
04 April 2018, 10:30
| Scenario | |
|---|---|
| Timeframe | Intraday |
| Recommendation | BUY STOP |
| Entry Point | 0.7305 |
| Take Profit | 0.7353 |
| Stop Loss | 0.7270 |
| Key Levels | 0.7200, 0.7243, 0.7261, 0.7278, 0.7300, 0.7324, 0.7353 |
| Alternative scenario | |
|---|---|
| Recommendation | SELL STOP |
| Entry Point | 0.7270 |
| Take Profit | 0.7243, 0.7230 |
| Stop Loss | 0.7300 |
| Key Levels | 0.7200, 0.7243, 0.7261, 0.7278, 0.7300, 0.7324, 0.7353 |
Current trend
NZD is strengthening against USD due to the weakening of US currency, the growth of concerns upon the potential trading war with China and poor macroeconomic data.
Monday’s US ISM Manufacturing PMI release was worse than expected. In March the index decreased from 60.8 to 59.3 points, which can reflect the decrease in the industrial productions volumes. Yesterday the April IBD/TIPP index of economic optimism did not meet the expectations and decreased from 55.6 to 52.6 points.
Today ADP Employment Change release is expected. The indicator is advanced to the federal one, which will be published on Friday. In March the decrease from 235 to 208K is expected. The investors are focused on ISM Non-Manufacturing PMI release. In March it is expected to fall from 59.5 to 59.0 points.
Support and resistance
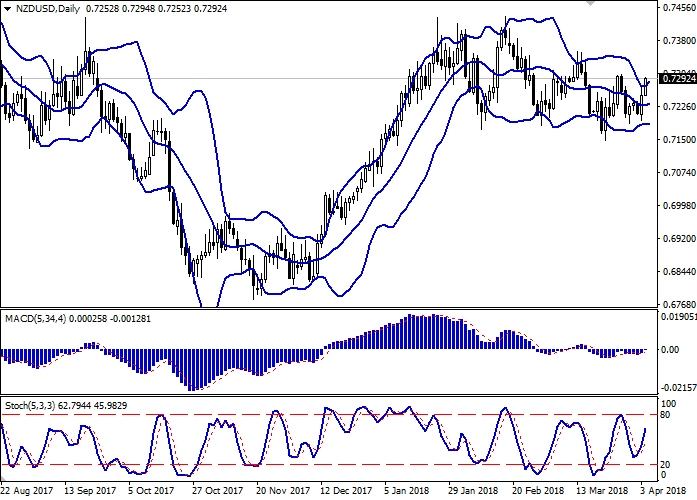
On the daily chart, Bollinger Bands are moving flat. The price range is slightly widening from above but not as fast as the “bullish” dynamic is developing. MACD is growing, keeping a moderate buy signal (the histogram is above the signal line). Stochastic’s dynamic is the same; the indicator is reaching its highs.
In general, the technical indicators’ readings do not contradict with the further development of the “bullish” trend in the short term.
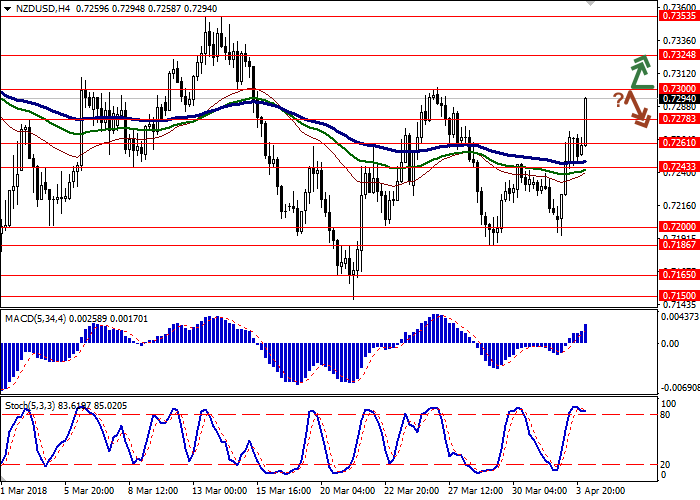
Resistance levels: 0.7300, 0.7324, 0.7353.
Support levels: 0.7278, 0.7261, 0.7243, 0.7200.


Trading tips
Long positions can be opened after the breakout of the level 0.7300 with the target at 0.7353 and stop loss 0.7270.
Short positions can be opened after the rebound at the level of 0.7300 and the breakdown of the level 0.7278 with the targets at 0.7243–0.7230 and stop loss 0.7300.
Implementation period: 2–3 days.
NZD is strengthening against USD due to the weakening of US currency, the growth of concerns upon the potential trading war with China and poor macroeconomic data.
Monday’s US ISM Manufacturing PMI release was worse than expected. In March the index decreased from 60.8 to 59.3 points, which can reflect the decrease in the industrial productions volumes. Yesterday the April IBD/TIPP index of economic optimism did not meet the expectations and decreased from 55.6 to 52.6 points.
Today ADP Employment Change release is expected. The indicator is advanced to the federal one, which will be published on Friday. In March the decrease from 235 to 208K is expected. The investors are focused on ISM Non-Manufacturing PMI release. In March it is expected to fall from 59.5 to 59.0 points.
Support and resistance
On the daily chart, Bollinger Bands are moving flat. The price range is slightly widening from above but not as fast as the “bullish” dynamic is developing. MACD is growing, keeping a moderate buy signal (the histogram is above the signal line). Stochastic’s dynamic is the same; the indicator is reaching its highs.
In general, the technical indicators’ readings do not contradict with the further development of the “bullish” trend in the short term.
Resistance levels: 0.7300, 0.7324, 0.7353.
Support levels: 0.7278, 0.7261, 0.7243, 0.7200.


Trading tips
Long positions can be opened after the breakout of the level 0.7300 with the target at 0.7353 and stop loss 0.7270.
Short positions can be opened after the rebound at the level of 0.7300 and the breakdown of the level 0.7278 with the targets at 0.7243–0.7230 and stop loss 0.7300.
Implementation period: 2–3 days.


No comments:
Write comments