Bitcoin: technical analysis
04 April 2018, 11:24
| Scenario | |
|---|---|
| Timeframe | Intraday |
| Recommendation | BUY STOP |
| Entry Point | 7550.00 |
| Take Profit | 7812.50, 8125.00 |
| Stop Loss | 7350.00 |
| Key Levels | 6562.50, 6875.00, 7187.50, 7500.00, 7812.50, 8125.00 |
| Alternative scenario | |
|---|---|
| Recommendation | SELL STOP |
| Entry Point | 7020.00 |
| Take Profit | 6875.00, 6562.50 |
| Stop Loss | 7200.00 |
| Key Levels | 6562.50, 6875.00, 7187.50, 7500.00, 7812.50, 8125.00 |
Current trend
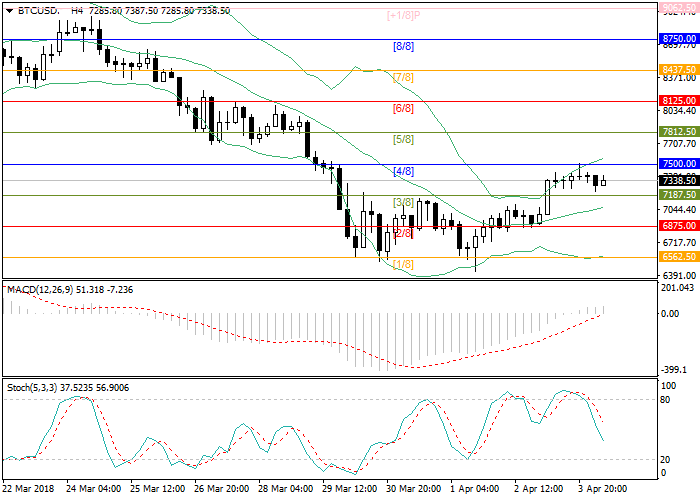
Bitcoin price tried to grow, but met a resistance at the level of 7500.00 (Murray [4/8]) and was corrected downwards.
The main target of the downward movement is the level of 7075.00, corresponding to the middle line of Bollinger Bands. At the level of 7075.00, the reversal is possible, while the breakdown of it will let the price reach the area of 6875.00 (Murray [2/8])–6562.50 (Murray [1/8]).
Technical indicators mostly reflect the maintenance of the upward potential but do not exclude the downward correction. MACD volumes are gradually growing in the positive zone. Bollinger Bands are pointed upwards. However, the price has broken the upward border of the indicator, which reflects the possibility of the downward correction. Stochastic lines are pointed downwards. The upward trend will restore after the breakout and consolidation of the price above the level of 7500.00. In this case, the next buyer’s targets will be the levels of 7812.50 (Murray [5/8])–8125.00 (Murray [6/8]).
Support and resistance
Resistance levels: 7500.00, 7812.50, 8125.00.
Support levels: 7187.50, 6875.00, 6562.50.

Trading tips
Long positions can be opened above the level of 7500.00 with the targets at around 7812.50–8125.00 and stop loss 7350.00.
Short positions can be opened below the level of 7075.00 with the targets at around 6875.00–6562.50 and stop loss 7200.00.
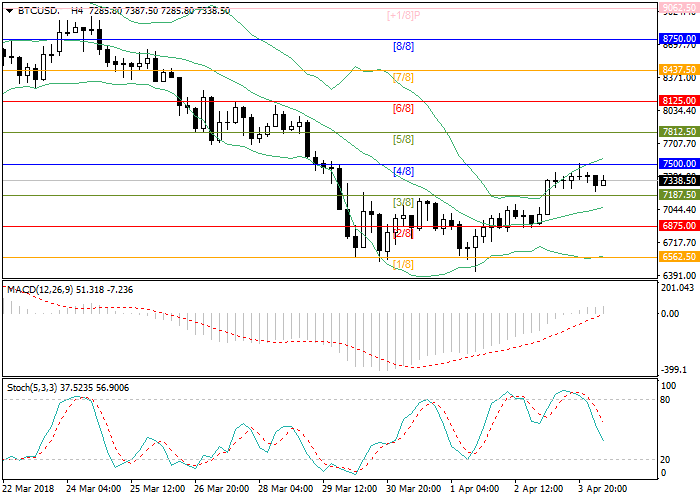
Bitcoin price tried to grow, but met a resistance at the level of 7500.00 (Murray [4/8]) and was corrected downwards.
The main target of the downward movement is the level of 7075.00, corresponding to the middle line of Bollinger Bands. At the level of 7075.00, the reversal is possible, while the breakdown of it will let the price reach the area of 6875.00 (Murray [2/8])–6562.50 (Murray [1/8]).
Technical indicators mostly reflect the maintenance of the upward potential but do not exclude the downward correction. MACD volumes are gradually growing in the positive zone. Bollinger Bands are pointed upwards. However, the price has broken the upward border of the indicator, which reflects the possibility of the downward correction. Stochastic lines are pointed downwards. The upward trend will restore after the breakout and consolidation of the price above the level of 7500.00. In this case, the next buyer’s targets will be the levels of 7812.50 (Murray [5/8])–8125.00 (Murray [6/8]).
Support and resistance
Resistance levels: 7500.00, 7812.50, 8125.00.
Support levels: 7187.50, 6875.00, 6562.50.

Trading tips
Long positions can be opened above the level of 7500.00 with the targets at around 7812.50–8125.00 and stop loss 7350.00.
Short positions can be opened below the level of 7075.00 with the targets at around 6875.00–6562.50 and stop loss 7200.00.


No comments:
Write comments