
NZD/USD: general review
05 April 2018, 13:42
| Scenario | |
|---|---|
| Timeframe | Intraday |
| Recommendation | BUY STOP |
| Entry Point | 0.7300 |
| Take Profit | 0.7350 |
| Stop Loss | 0.7270 |
| Key Levels | 0.7188, 0.7210, 0.7225, 0.7245, 0.7258, 0.7280, 0.7300, 0.7330, 0.7355 |
| Alternative scenario | |
|---|---|
| Recommendation | SELL STOP |
| Entry Point | 0.7250 |
| Take Profit | 0.7200 |
| Stop Loss | 0.7280 |
| Key Levels | 0.7188, 0.7210, 0.7225, 0.7245, 0.7258, 0.7280, 0.7300, 0.7330, 0.7355 |
Current trend
The pair showed positive dynamics on Wednesday amid the release of mixed economic data from the US.
Markit Services PMI fell to 54.0 points, and the ISM Non-Manufacturing PMI dropped to 58.8 points. Both indicators were below the predicted values. Factory orders in February increased by 1.2%, while growth was expected at least by 1.7%. ADP Employment Change report was stronger than expected: the indicator value was 241K, which should positively affect consumption, thus stimulating economic growth.
Today, the pair is falling amid a slowdown in the growth of the ANZ Commodity Price index in March. The growth rate was 1.2%, compared to 2.8% last month.
The main event of today will be the release of data on continuing jobless claims in the US (14:30 GMT+2), moderate volatility is expected in the market.
Support and resistance
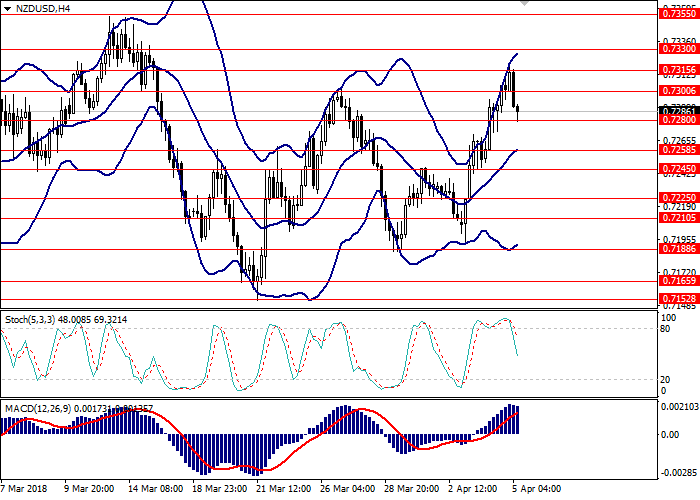
On the H4 chart the instrument is trading between the upper and middle lines of Bollinger Bands. The price range is widened indicating possible continuation of the upward trend.
MACD histogram is in the positive area. The signal line is crossing the body of the histogram from below giving a signal for opening buy positions.
Support levels: 0.7280, 0.7258, 0.7245, 0.7225, 0.7210, 0.7188.
Resistance levels: 0.7300, 0.7330, 0.7355.
Trading tips
Long positions may be opened from the level of 0.7300 with target at 0.7350 and stop-loss at 0.7270.
Short positions may be opened from the level of 0.7250 with target at 0.7200 and stop-loss at 0.7280. Implementation period: 1-3 days.
The pair showed positive dynamics on Wednesday amid the release of mixed economic data from the US.
Markit Services PMI fell to 54.0 points, and the ISM Non-Manufacturing PMI dropped to 58.8 points. Both indicators were below the predicted values. Factory orders in February increased by 1.2%, while growth was expected at least by 1.7%. ADP Employment Change report was stronger than expected: the indicator value was 241K, which should positively affect consumption, thus stimulating economic growth.
Today, the pair is falling amid a slowdown in the growth of the ANZ Commodity Price index in March. The growth rate was 1.2%, compared to 2.8% last month.
The main event of today will be the release of data on continuing jobless claims in the US (14:30 GMT+2), moderate volatility is expected in the market.
Support and resistance
On the H4 chart the instrument is trading between the upper and middle lines of Bollinger Bands. The price range is widened indicating possible continuation of the upward trend.
MACD histogram is in the positive area. The signal line is crossing the body of the histogram from below giving a signal for opening buy positions.
Support levels: 0.7280, 0.7258, 0.7245, 0.7225, 0.7210, 0.7188.
Resistance levels: 0.7300, 0.7330, 0.7355.
Trading tips
Long positions may be opened from the level of 0.7300 with target at 0.7350 and stop-loss at 0.7270.
Short positions may be opened from the level of 0.7250 with target at 0.7200 and stop-loss at 0.7280. Implementation period: 1-3 days.


No comments:
Write comments