
GBP/USD: the pound shows growth
10 April 2018, 09:31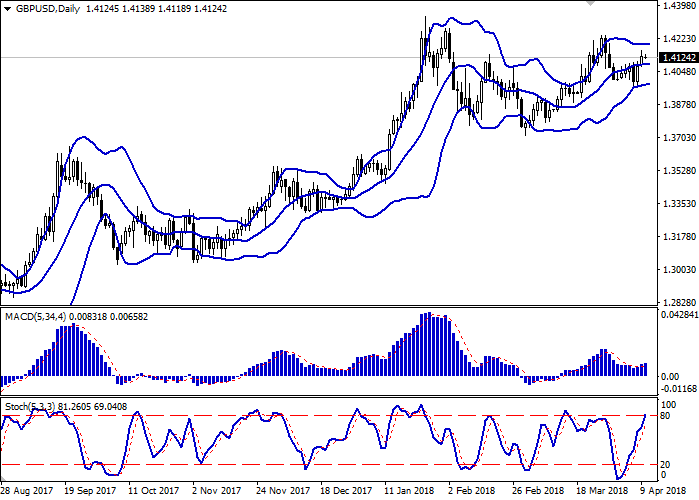
| Scenario | |
|---|---|
| Timeframe | Intraday |
| Recommendation | BUY STOP |
| Entry Point | 1.4170 |
| Take Profit | 1.4242, 1.4260 |
| Stop Loss | 1.4120, 1.4100 |
| Key Levels | 1.3963, 1.4000, 1.4068, 1.4100, 1.4162, 1.4200, 1.4242 |
| Alternative scenario | |
|---|---|
| Recommendation | SELL STOP |
| Entry Point | 1.4090 |
| Take Profit | 1.4000 |
| Stop Loss | 1.4150, 1.4160 |
| Key Levels | 1.3963, 1.4000, 1.4068, 1.4100, 1.4162, 1.4200, 1.4242 |
Current trend
GBP showed growth against USD in trading on Monday, continuing the development of a powerful correction impulse formed at the end of last week. The instrument grew against the background of a calm beginning of the week in terms of macroeconomics and the publication of quite strong data on house prices from Halifax for March.
GBP strengthened mostly due to the USA-China trade conflict development. In addition, the investors are focused on Brexit negotiations, as the new contentious issue has raised – Gibraltar question. Now it is the Overseas Territory of Great Britain, but Spain has a long-standing claim to it. In case of UK leaving EU, Madrid demands shared administration of the Gibraltarian airport and a partnership in the border control issues.
Support and resistance
Bollinger Bands in D1 chart demonstrate flat dynamics. The price range is unchanged, but it remains rather spacious for the current level of activity in the market.
MACD indicator is growing preserving a moderate buy signal (the histogram is above the signal line).
Stochastic shows similar dynamics, with the only difference that the indicator is already approaching its maximum marks, which signals an overbought pound in the nearest term.
At the moment, the indicators do not contradict the further development of the uptrend in the short and/or ultra-short term.
Resistance levels: 1.4162, 1.4200, 1.4242.
Support levels: 1.4100, 1.4068, 1.4000, 1.3963.
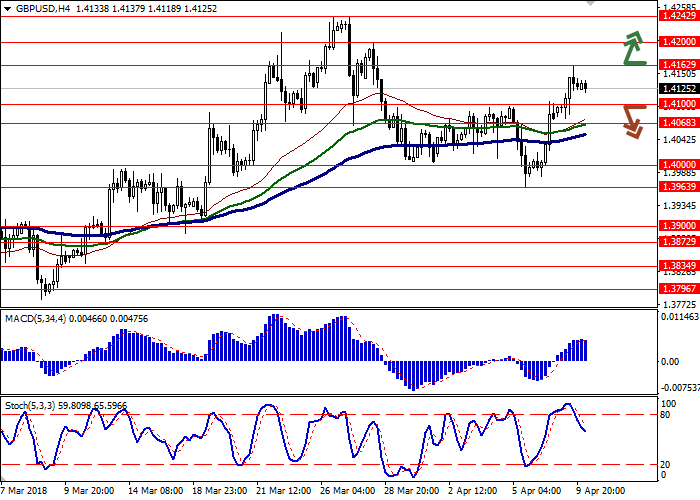

Trading tips
To open long positions one can rely on the breakout of the level of 1.4162, while maintaining "bullish" signals from technical indicators. Take-profit – 1.4242–1.4260. Stop-loss – 1.4120–1.4100. Implementation period: 2-3 days.
The development of correctional trend with the breakdown of the level of 1.4100 may become a signal to begin sales with target at 1.4000. Stop-loss – 1.4150–1.4160. Implementation period: 2-3 days.
GBP showed growth against USD in trading on Monday, continuing the development of a powerful correction impulse formed at the end of last week. The instrument grew against the background of a calm beginning of the week in terms of macroeconomics and the publication of quite strong data on house prices from Halifax for March.
GBP strengthened mostly due to the USA-China trade conflict development. In addition, the investors are focused on Brexit negotiations, as the new contentious issue has raised – Gibraltar question. Now it is the Overseas Territory of Great Britain, but Spain has a long-standing claim to it. In case of UK leaving EU, Madrid demands shared administration of the Gibraltarian airport and a partnership in the border control issues.
Support and resistance
Bollinger Bands in D1 chart demonstrate flat dynamics. The price range is unchanged, but it remains rather spacious for the current level of activity in the market.
MACD indicator is growing preserving a moderate buy signal (the histogram is above the signal line).
Stochastic shows similar dynamics, with the only difference that the indicator is already approaching its maximum marks, which signals an overbought pound in the nearest term.
At the moment, the indicators do not contradict the further development of the uptrend in the short and/or ultra-short term.
Resistance levels: 1.4162, 1.4200, 1.4242.
Support levels: 1.4100, 1.4068, 1.4000, 1.3963.
Trading tips
To open long positions one can rely on the breakout of the level of 1.4162, while maintaining "bullish" signals from technical indicators. Take-profit – 1.4242–1.4260. Stop-loss – 1.4120–1.4100. Implementation period: 2-3 days.
The development of correctional trend with the breakdown of the level of 1.4100 may become a signal to begin sales with target at 1.4000. Stop-loss – 1.4150–1.4160. Implementation period: 2-3 days.


No comments:
Write comments