EUR/USD: the pair shows mixed dynamics
05 April 2018, 09:29
| Scenario | |
|---|---|
| Timeframe | Intraday |
| Recommendation | BUY STOP |
| Entry Point | 1.2320 |
| Take Profit | 1.2382, 1.2400 |
| Stop Loss | 1.2280 |
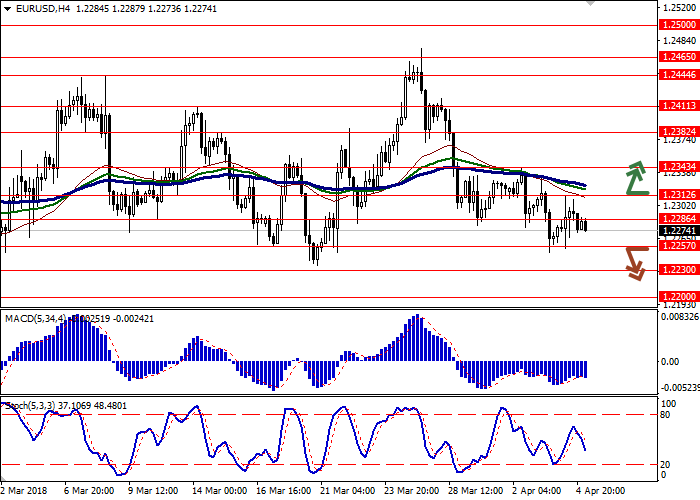
| Key Levels | 1.2200, 1.2230, 1.2257, 1.2286, 1.2312, 1.2343, 1.2382 |
| Alternative scenario | |
|---|---|
| Recommendation | SELL STOP |
| Entry Point | 1.2250 |
| Take Profit | 1.2200 |
| Stop Loss | 1.2286, 1.2300 |
| Key Levels | 1.2200, 1.2230, 1.2257, 1.2286, 1.2312, 1.2343, 1.2382 |
Current trend
The pair showed moderate growth on April 4, but could not hold onto the occupied positions and retreated to the initial levels.
Published on Wednesday, inflation data in the Eurozone were positive for the market. The CPI increased from 1.1% to 1.4%. The basic CPI remained at the same level of 1.0%. Investors are also watching the development of the US-China trade conflict since the EU can become the next enemy of the US. Trump's administration delayed the introduction of tariffs on metals for the EU before May 1. However, Brussels insists on abolishing the duties altogether. Otherwise, the EU reserves the right to introduce reciprocal duties on American goods and file lawsuits against the US in the WTO.
Today, March data on the index of business activity in the service sector for Germany and the Eurozone will be published. February data on retail sales in the Eurozone promise to be mixed.
Support and resistance
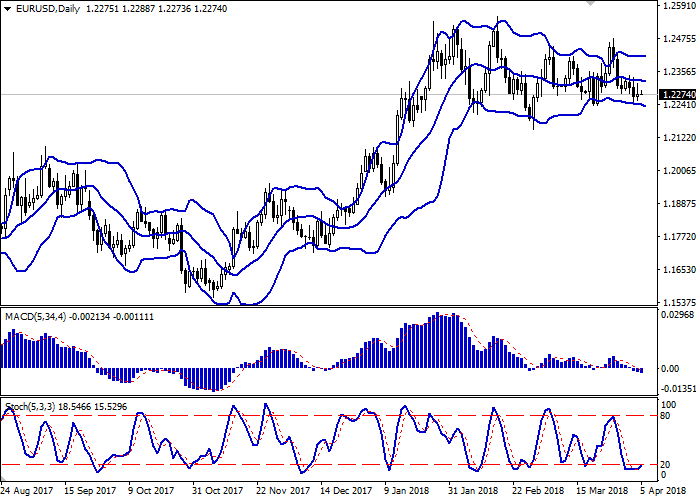
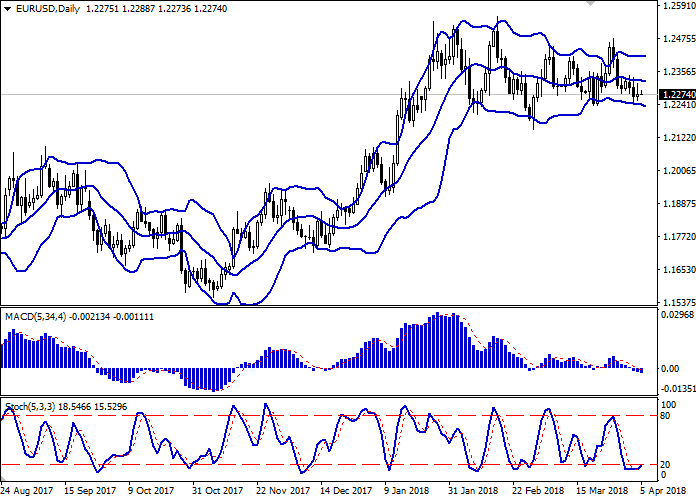
Bollinger Bands in D1 chart demonstrate flat dynamics. The price range remains practically unchanged.
MACD is going down preserving the previous sell signal (histogram is located below the signal line).
Stochastic is preparing to turn upwards, which can be a good signal for corrective purchases.
The technical indicators remain contradictory; therefore, to open new positions, it is necessary to wait for clarification of the situation.
Resistance levels: 1.2286, 1.2312, 1.2343, 1.2382.
Support levels: 1.2257, 1.2230, 1.2200.


Trading tips
To open long positions, one can rely on the breakout of 1.2312 mark. Take-profit — 1.2382 or 1.2400. Stop-loss – 1.2280. Implementation period: 2-3 days.
The development of "bearish" trend with the breakdown of the level of 1.2257 may become a signal for further sales with target at 1.2200. Stop-loss — 1.2286, 1.2300. Implementation period: 2 days.
The pair showed moderate growth on April 4, but could not hold onto the occupied positions and retreated to the initial levels.
Published on Wednesday, inflation data in the Eurozone were positive for the market. The CPI increased from 1.1% to 1.4%. The basic CPI remained at the same level of 1.0%. Investors are also watching the development of the US-China trade conflict since the EU can become the next enemy of the US. Trump's administration delayed the introduction of tariffs on metals for the EU before May 1. However, Brussels insists on abolishing the duties altogether. Otherwise, the EU reserves the right to introduce reciprocal duties on American goods and file lawsuits against the US in the WTO.
Today, March data on the index of business activity in the service sector for Germany and the Eurozone will be published. February data on retail sales in the Eurozone promise to be mixed.
Support and resistance
Bollinger Bands in D1 chart demonstrate flat dynamics. The price range remains practically unchanged.
MACD is going down preserving the previous sell signal (histogram is located below the signal line).
Stochastic is preparing to turn upwards, which can be a good signal for corrective purchases.
The technical indicators remain contradictory; therefore, to open new positions, it is necessary to wait for clarification of the situation.
Resistance levels: 1.2286, 1.2312, 1.2343, 1.2382.
Support levels: 1.2257, 1.2230, 1.2200.


Trading tips
To open long positions, one can rely on the breakout of 1.2312 mark. Take-profit — 1.2382 or 1.2400. Stop-loss – 1.2280. Implementation period: 2-3 days.
The development of "bearish" trend with the breakdown of the level of 1.2257 may become a signal for further sales with target at 1.2200. Stop-loss — 1.2286, 1.2300. Implementation period: 2 days.


No comments:
Write comments