XAG/USD: silver prices are going down
30 March 2018, 10:06
| Scenario | |
|---|---|
| Timeframe | Intraday |
| Recommendation | BUY STOP |
| Entry Point | 16.30 |
| Take Profit | 16.43 |
| Stop Loss | 16.20 |
| Key Levels | 16.03, 16.06, 16.13, 16.20, 16.27, 16.34, 16.43, 16.51 |
| Alternative scenario | |
|---|---|
| Recommendation | SELL STOP |
| Entry Point | 16.10 |
| Take Profit | 16.00, 15.90 |
| Stop Loss | 16.20 |
| Key Levels | 16.03, 16.06, 16.13, 16.20, 16.27, 16.34, 16.43, 16.51 |
Current trend
Prices for silver fell noticeably on Thursday trading, having retreated to local lows since March 21. The reason for the next decline was the optimistic sentiment of traders on USD, which was in demand against the background of mixed macroeconomic data from the US and the approach of long Easter holidays.
Investors reacted positively to the publication of the February statistics on income and personal expenditure from the US. Among the negative points in the statistics there is the Chicago PMI Index, which collapsed from 61.9 to 57.4 points, and the University of Michigan Consumer Sentiment Index, which declined from 102.0 to 101.4 points.
Support and resistance
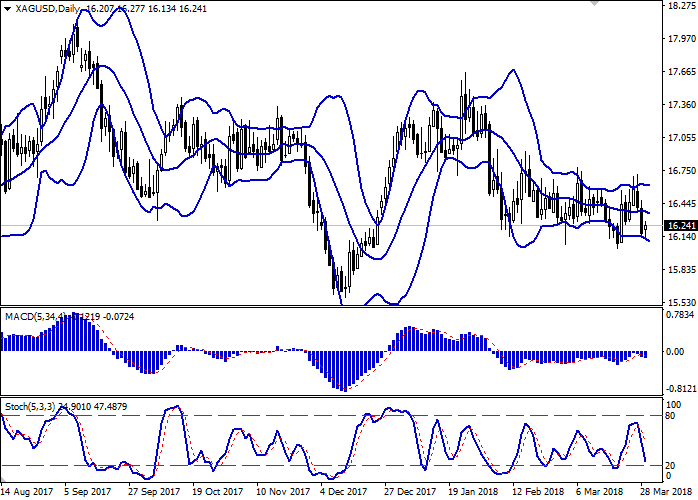
Bollinger Bands in D1 chart demonstrate a slight decrease. The price range is expanding reluctantly from below, remaining quite spacious.
MACD reversed downwards having formed a weak sell signal (histogram is located below the signal line).
Stochastic demonstrates more confident downward dynamics and is already approaching its minimum levels, indicating that the instrument is oversold in the short or ultra-short term.
At the moment, technical indicators do not contradict the further development of "bearish" trend. The indicators have not yet reacted to the attempt of corrective growth of the instrument today.
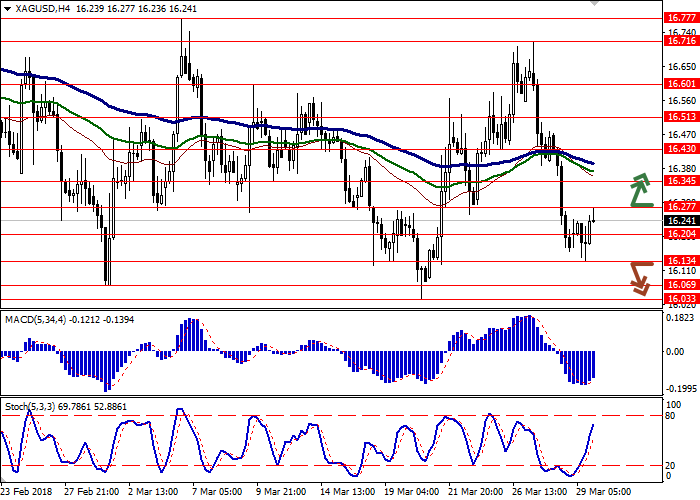
Resistance levels: 16.27, 16.34, 16.43, 16.51.
Support levels: 16.20, 16.13, 16.06, 16.03.


Trading tips
To open long positions one can rely on the breakout of the level of 16.27, while maintaining "bullish" signals from technical indicators. Take-profit – 16.43. Stop-loss – 16.20. Implementation period: 2-3 days.
The variant with the return of "bearish" dynamics to the market with a breakdown of the level of 16.13 down may become an alternative. In this case, the target of the "bears" may be located around 16.00 or 15.90 marks. Stop-loss – 16.20. Implementation period: 2-3 days.
Prices for silver fell noticeably on Thursday trading, having retreated to local lows since March 21. The reason for the next decline was the optimistic sentiment of traders on USD, which was in demand against the background of mixed macroeconomic data from the US and the approach of long Easter holidays.
Investors reacted positively to the publication of the February statistics on income and personal expenditure from the US. Among the negative points in the statistics there is the Chicago PMI Index, which collapsed from 61.9 to 57.4 points, and the University of Michigan Consumer Sentiment Index, which declined from 102.0 to 101.4 points.
Support and resistance
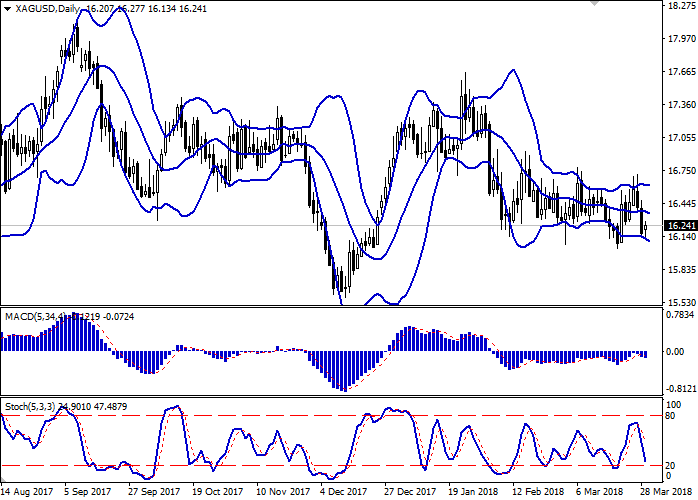
Bollinger Bands in D1 chart demonstrate a slight decrease. The price range is expanding reluctantly from below, remaining quite spacious.
MACD reversed downwards having formed a weak sell signal (histogram is located below the signal line).
Stochastic demonstrates more confident downward dynamics and is already approaching its minimum levels, indicating that the instrument is oversold in the short or ultra-short term.
At the moment, technical indicators do not contradict the further development of "bearish" trend. The indicators have not yet reacted to the attempt of corrective growth of the instrument today.
Resistance levels: 16.27, 16.34, 16.43, 16.51.
Support levels: 16.20, 16.13, 16.06, 16.03.


Trading tips
To open long positions one can rely on the breakout of the level of 16.27, while maintaining "bullish" signals from technical indicators. Take-profit – 16.43. Stop-loss – 16.20. Implementation period: 2-3 days.
The variant with the return of "bearish" dynamics to the market with a breakdown of the level of 16.13 down may become an alternative. In this case, the target of the "bears" may be located around 16.00 or 15.90 marks. Stop-loss – 16.20. Implementation period: 2-3 days.


No comments:
Write comments