
WTI Crude Oil: oil prices are unstable
29 March 2018, 09:29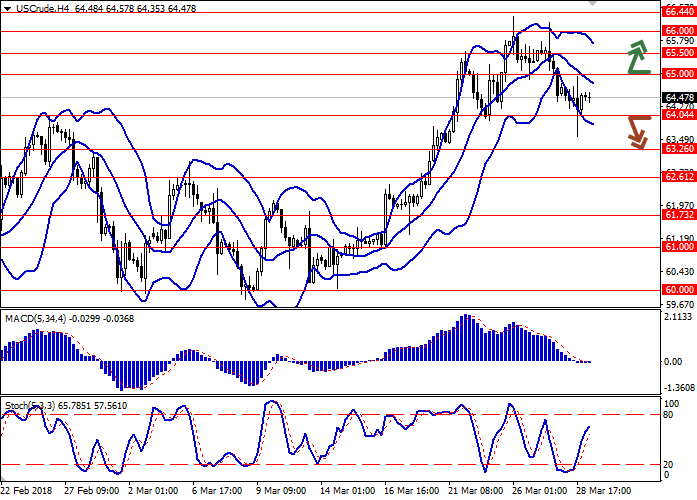
| Scenario | |
|---|---|
| Timeframe | Intraday |
| Recommendation | BUY STOP |
| Entry Point | 65.10 |
| Take Profit | 66.00, 66.44 |
| Stop Loss | 64.50 |
| Key Levels | 61.73, 62.61, 63.26, 64.04, 65.00, 65.50, 66.00, 66.44 |
| Alternative scenario | |
|---|---|
| Recommendation | SELL STOP |
| Entry Point | 64.00 |
| Take Profit | 63.26, 63.00, 62.61 |
| Stop Loss | 64.60, 64.70 |
| Key Levels | 61.73, 62.61, 63.26, 64.04, 65.00, 65.50, 66.00, 66.44 |
Current trend
Oil prices declined significantly during Wednesday trading, reacting to the publication of statistics on stocks from the US Department of Energy. Additional pressure on the instrument was exerted by the growth of USD after the publication of strong data on US GDP for Q4 2017. Nevertheless, closer to the end of the afternoon session, the instrument managed to win back most of its losses, so the final decline was insignificant.
During a week on March 23, oil stocks in US warehouses unexpectedly increased by 1.643 million barrels, after a decrease of 2.622 million barrels over the past period. Analysts had expected negative dynamics to remain at –0.287 million barrels.
Support and resistance
Bollinger Bands in H4 chart demonstrate a steady decrease. The price range is narrowing, reflecting the emergence of flat dynamics of trading.
The MACD indicator is trying to turn upwards, being located in immediate proximity from a zero mark.
Stochastic, in turn, continues to grow steadily, rapidly approaching its maximum marks.
At the moment, the showings of technical indicators diverge, so to select a trading strategy, it is better to rely only on some of them, or to wait for clarification of the situation.
Resistance levels: 65.00, 65.50, 66.00, 66.44.
Support levels: 64.04, 63.26, 62.61, 61.73.

Trading tips
To open long positions one can rely on the breakout of the level of 65.00, while maintaining "bullish" signals from technical indicators. Take-profit – 66.00–66.44. Stop-loss – 64.50. Implementation period: 2-3 days.
The development of "bearish" dynamics with the breakdown of the level of 64.04 may become a signal for further sales with targets at 63.26–63.00 or 62.61. Stop-loss — 64.60–64.70. Implementation period: 2-3 days.
Oil prices declined significantly during Wednesday trading, reacting to the publication of statistics on stocks from the US Department of Energy. Additional pressure on the instrument was exerted by the growth of USD after the publication of strong data on US GDP for Q4 2017. Nevertheless, closer to the end of the afternoon session, the instrument managed to win back most of its losses, so the final decline was insignificant.
During a week on March 23, oil stocks in US warehouses unexpectedly increased by 1.643 million barrels, after a decrease of 2.622 million barrels over the past period. Analysts had expected negative dynamics to remain at –0.287 million barrels.
Support and resistance
Bollinger Bands in H4 chart demonstrate a steady decrease. The price range is narrowing, reflecting the emergence of flat dynamics of trading.
The MACD indicator is trying to turn upwards, being located in immediate proximity from a zero mark.
Stochastic, in turn, continues to grow steadily, rapidly approaching its maximum marks.
At the moment, the showings of technical indicators diverge, so to select a trading strategy, it is better to rely only on some of them, or to wait for clarification of the situation.
Resistance levels: 65.00, 65.50, 66.00, 66.44.
Support levels: 64.04, 63.26, 62.61, 61.73.
Trading tips
To open long positions one can rely on the breakout of the level of 65.00, while maintaining "bullish" signals from technical indicators. Take-profit – 66.00–66.44. Stop-loss – 64.50. Implementation period: 2-3 days.
The development of "bearish" dynamics with the breakdown of the level of 64.04 may become a signal for further sales with targets at 63.26–63.00 or 62.61. Stop-loss — 64.60–64.70. Implementation period: 2-3 days.


No comments:
Write comments