
Adobe Systems Inc. (ADBE/NASD): general analysis
28 March 2018, 12:12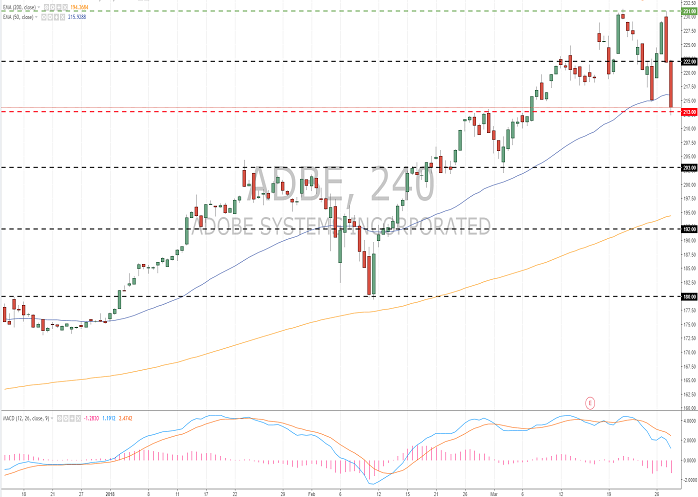
| Scenario | |
|---|---|
| Timeframe | Intraday |
| Recommendation | SELL STOP |
| Entry Point | 212.90 |
| Take Profit | 205.00, 200.00, 193.00 |
| Stop Loss | 220.00 |
| Key Levels | 192.00, 203.00, 213.00, 222.00, 231.00 |
| Alternative scenario | |
|---|---|
| Recommendation | BUY STOP |
| Entry Point | 222.10 |
| Take Profit | 235.00, 240.00 |
| Stop Loss | 215.00 |
| Key Levels | 192.00, 203.00, 213.00, 222.00, 231.00 |
Current trend
In the middle of March, Adobe published Q1, 2018, report with the financial results above the market’s expectations. The income of the company grew by 24% YoY to the record 2.08 billion USD due to the increase in the number of Creative Cloud subscribers and profit per user. The corrected EPS reached 1.55 USD. The company’ forecast remained unchanged, however, in the current quarter, the profit and EPS is expected to reache 2.15 billion USD and 1.53 USD, which is above the market’s expectations.
During the last week, Adobe decreased by 6.94% against the fall of S&P 500 index by 3.66%.
Support and resistance
Yesterday, the instrument kept the resistance level of 231.00, which caused the aggressive sales. The decrease of #ADBE exceeded 6.5%. The stocks are now testing the key support level of 213.00. The level of 222.00 is the nearest resistance. The further correction is not excluded. MACD histogram is in the negative zone and decreasing, reflecting the strength of sellers. It is better to open the positions according to the current trend.
The comparative analysis of the indicators of the company and its competitors suggests the neutrality of its share prices.
Resistance levels: 222.00, 231.00.
Support levels: 213.00, 203.00, 192.00.

Trading tips
Short positions can be opened after the price is set below the level of 213.00. The closing of the profitable positions is possible at the levels of 205.00, 200.00 and 193.00. Stop loss is 220.00.
Long positions can be opened after the price is set above the level of 222.00 with the targets at 235.00–240.00. Stop loss is 215.00.
Implementation period: 3 days.
In the middle of March, Adobe published Q1, 2018, report with the financial results above the market’s expectations. The income of the company grew by 24% YoY to the record 2.08 billion USD due to the increase in the number of Creative Cloud subscribers and profit per user. The corrected EPS reached 1.55 USD. The company’ forecast remained unchanged, however, in the current quarter, the profit and EPS is expected to reache 2.15 billion USD and 1.53 USD, which is above the market’s expectations.
During the last week, Adobe decreased by 6.94% against the fall of S&P 500 index by 3.66%.
Support and resistance
Yesterday, the instrument kept the resistance level of 231.00, which caused the aggressive sales. The decrease of #ADBE exceeded 6.5%. The stocks are now testing the key support level of 213.00. The level of 222.00 is the nearest resistance. The further correction is not excluded. MACD histogram is in the negative zone and decreasing, reflecting the strength of sellers. It is better to open the positions according to the current trend.
The comparative analysis of the indicators of the company and its competitors suggests the neutrality of its share prices.
Resistance levels: 222.00, 231.00.
Support levels: 213.00, 203.00, 192.00.
Trading tips
Short positions can be opened after the price is set below the level of 213.00. The closing of the profitable positions is possible at the levels of 205.00, 200.00 and 193.00. Stop loss is 220.00.
Long positions can be opened after the price is set above the level of 222.00 with the targets at 235.00–240.00. Stop loss is 215.00.
Implementation period: 3 days.


No comments:
Write comments